4 Years of Salary Data, Redesigned, 75% Accurate Chart Reads
Product Design / Data Visualization
Over four years, as a Senior Designer at JobVision, I redesigned the Annual Salary Report to simplify complex data, improve navigation, and ensure easy updates.

Team
Moein Saboohi
Senior Designer
Paniz Ezzati
Graphic Designer
Mahdi Kazemi
Data Storyteller
Fatemeh Mianabadi
Business Analyst
Saeed Akbari
Campaign Manager
Duration
April 2021 – December 2024
3 years and 8 months
Softwares

Adobe Photoshop

Adobe Illustrator

Figma

Figjam

Microsoft Excel
Overview
Over four consecutive years, I designed the JobVision Annual Salary Report, a comprehensive resource aimed at improving salary transparency in Iran’s job market. By combining data-driven insights with user-centric design, the report provided essential guidance to both job seekers and employers. Its influence extended beyond individual users, establishing JobVision as a trusted authority in salary research and driving significant brand awareness.The project required creative solutions to present vast amounts of complex data in a way that was both accessible and actionable, ensuring its impact on users and the recruitment industry at large.
The Problem
The problem was transforming complex salary data into a user-friendly, editable report to improve job market transparency in Iran, enabling easy access and understanding for job seekers and employers.
Salary transparency is a recurring challenge in Iran’s job market.
For job seekers, it wasn’t easy to assess fair salary expectations for their skills and positions.
For employers and HR managers, determining competitive salary ranges that aligned with industry standards was equally challenging.
To address this, JobVision collected annual survey data from thousands of individuals, including:
Current Salaries: The wages individuals were earning in their current roles.
Desired Salaries: The income they hoped to receive in the upcoming year.
The objective was to analyze this data and present clear salary benchmarks across:
Over 75 job categories.
Four seniority levels (Junior, Mid-level, Senior, and Managerial).
Different geographic regions (All Cities of Iran).
Translating this extensive dataset into an intuitive and user-friendly report presented a significant challenge. In our designs, we encountered the following issues:
Massive data volume: Presenting extensive data in an understandable way.
Complex categorization and visualization: Organizing data for 75+ job categories across 4 seniority levels and multiple geographic regions, ensuring users could quickly find relevant information.
Editable designs: Allowing JobVision’s team to easily update and manage report content.
These challenges underscored the need for a well-planned, iterative design process.
Design Approach
The design approach blended data-driven and human-centered methods to create a precise, user-friendly salary report, evolving through research, iteration, collaboration, and user testing.
The project adopted a data-driven design approach to ensure clarity and precision in presenting large amounts of information. However, data visualization alone was not enough. I integrated a human-centered design approach to ensure that the final solution was both user-friendly and aligned with the needs of the audience.
Key Actions in My Approach
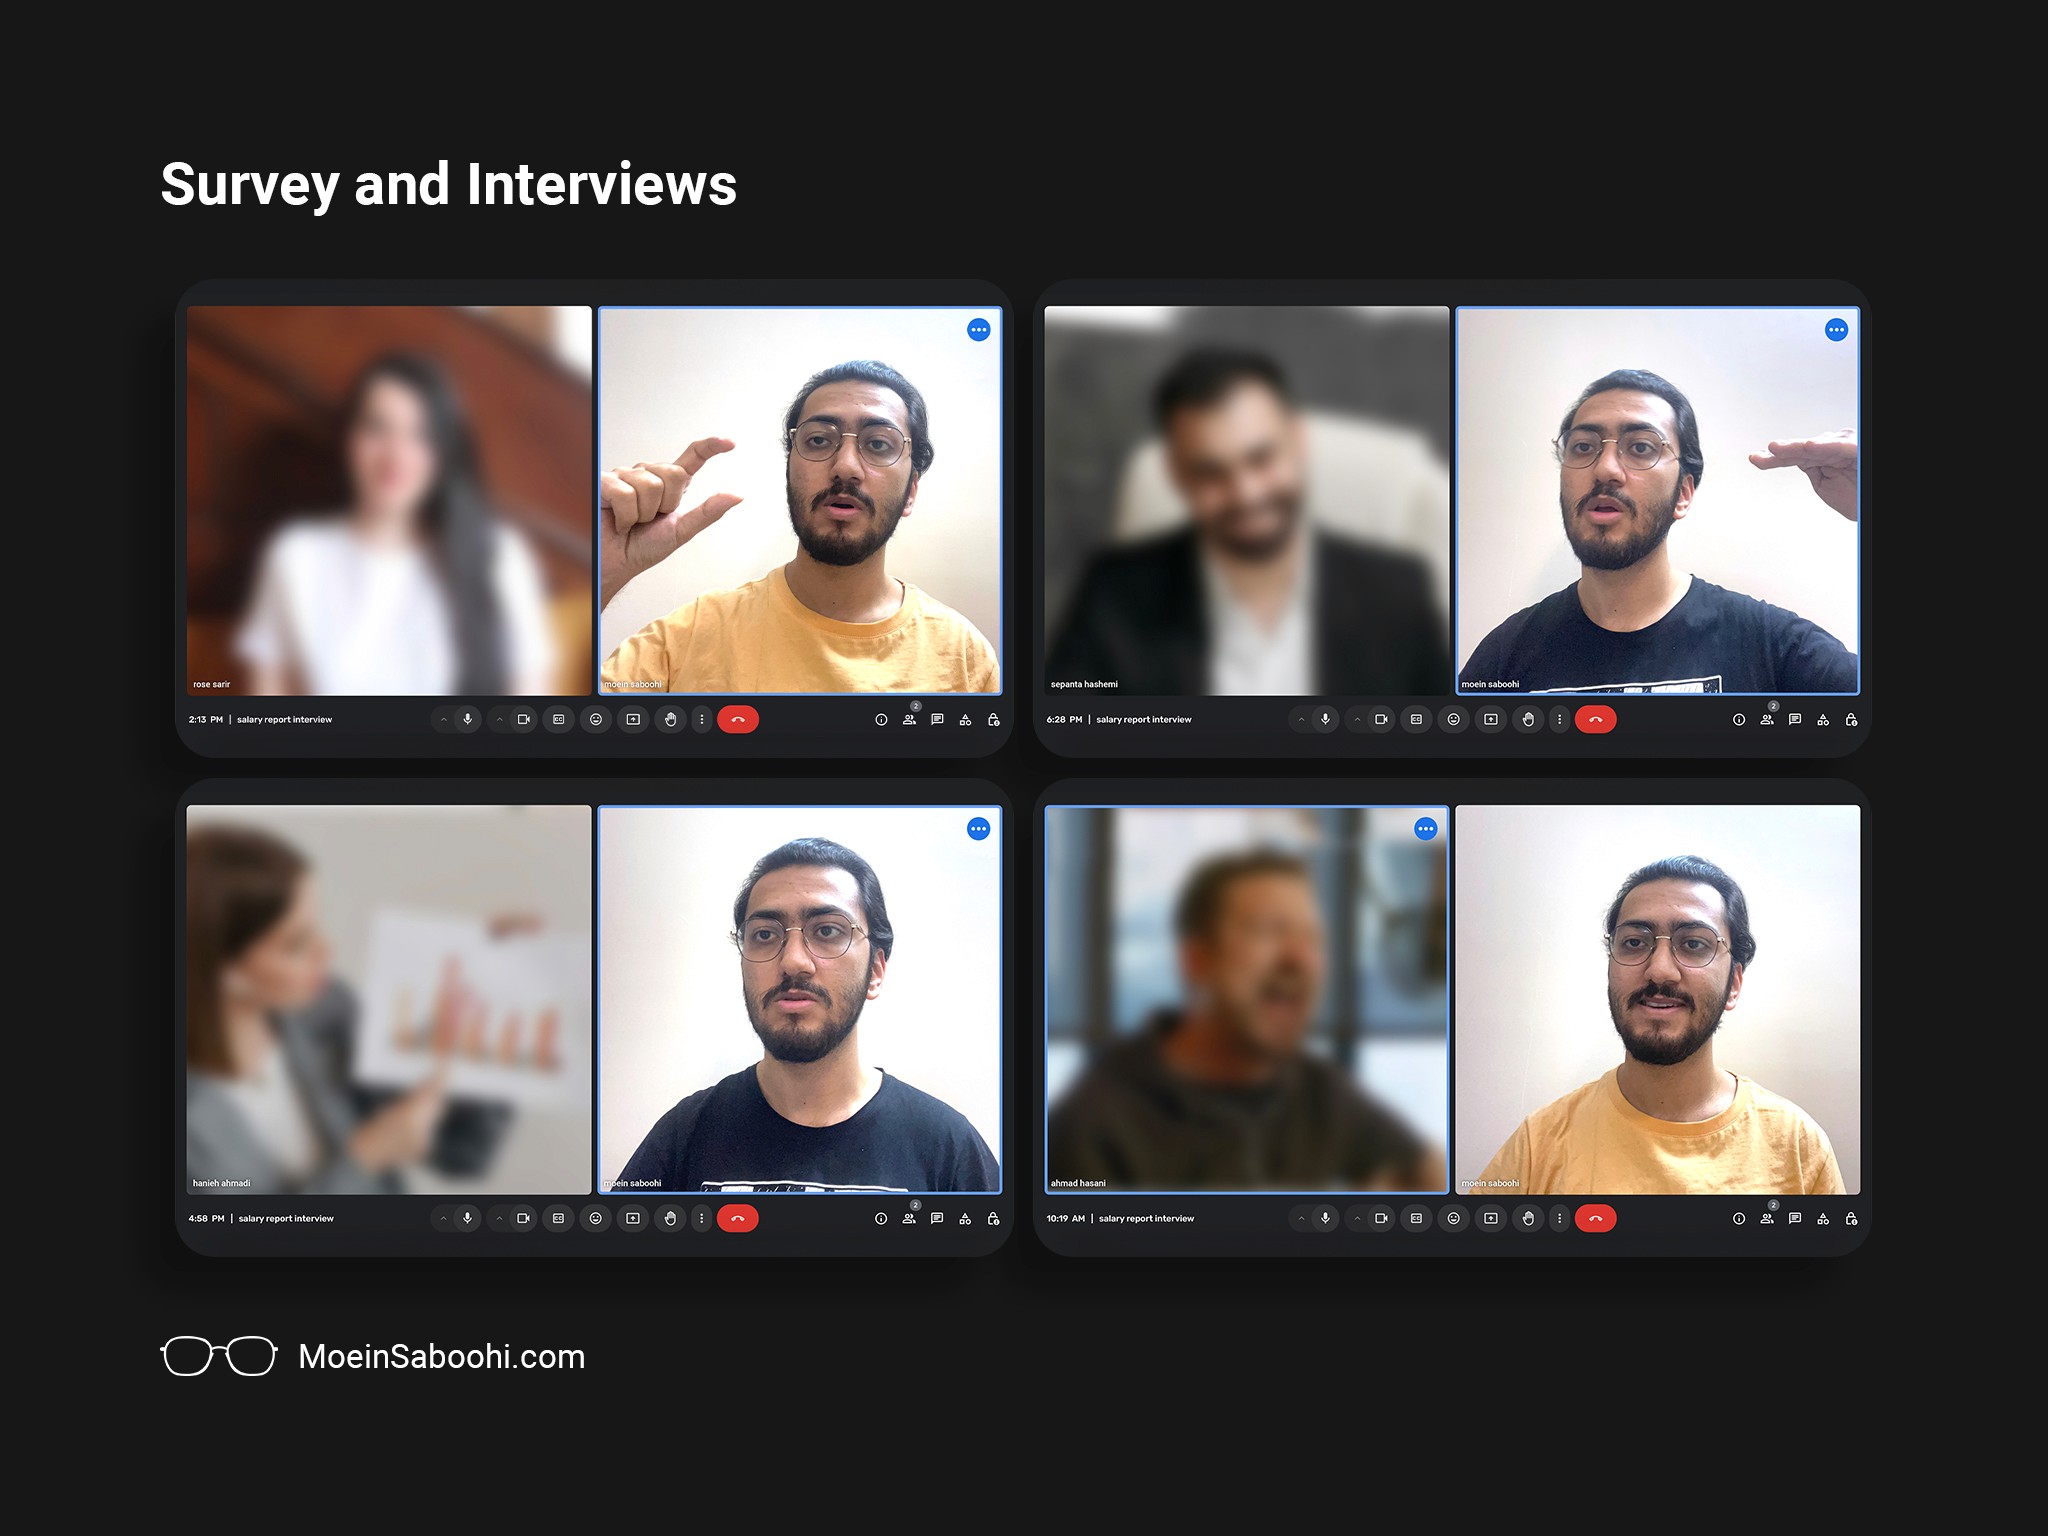
Research: Gaining insights into user needs through surveys and interviews.
Iteration: Designing, testing, and refining the report based on user feedback.
Collaboration: Working closely with stakeholders to align on goals and ensure feasibility.
User Testing: Validating the designs through multiple rounds of usability testing.
This iterative process allowed me to refine the design with each successive year, ensuring continual improvement and alignment with user expectations.
Research
User personas and journey mapping informed a simplified, accessible design, while analyzing global salary reports helped align the solution with user needs.
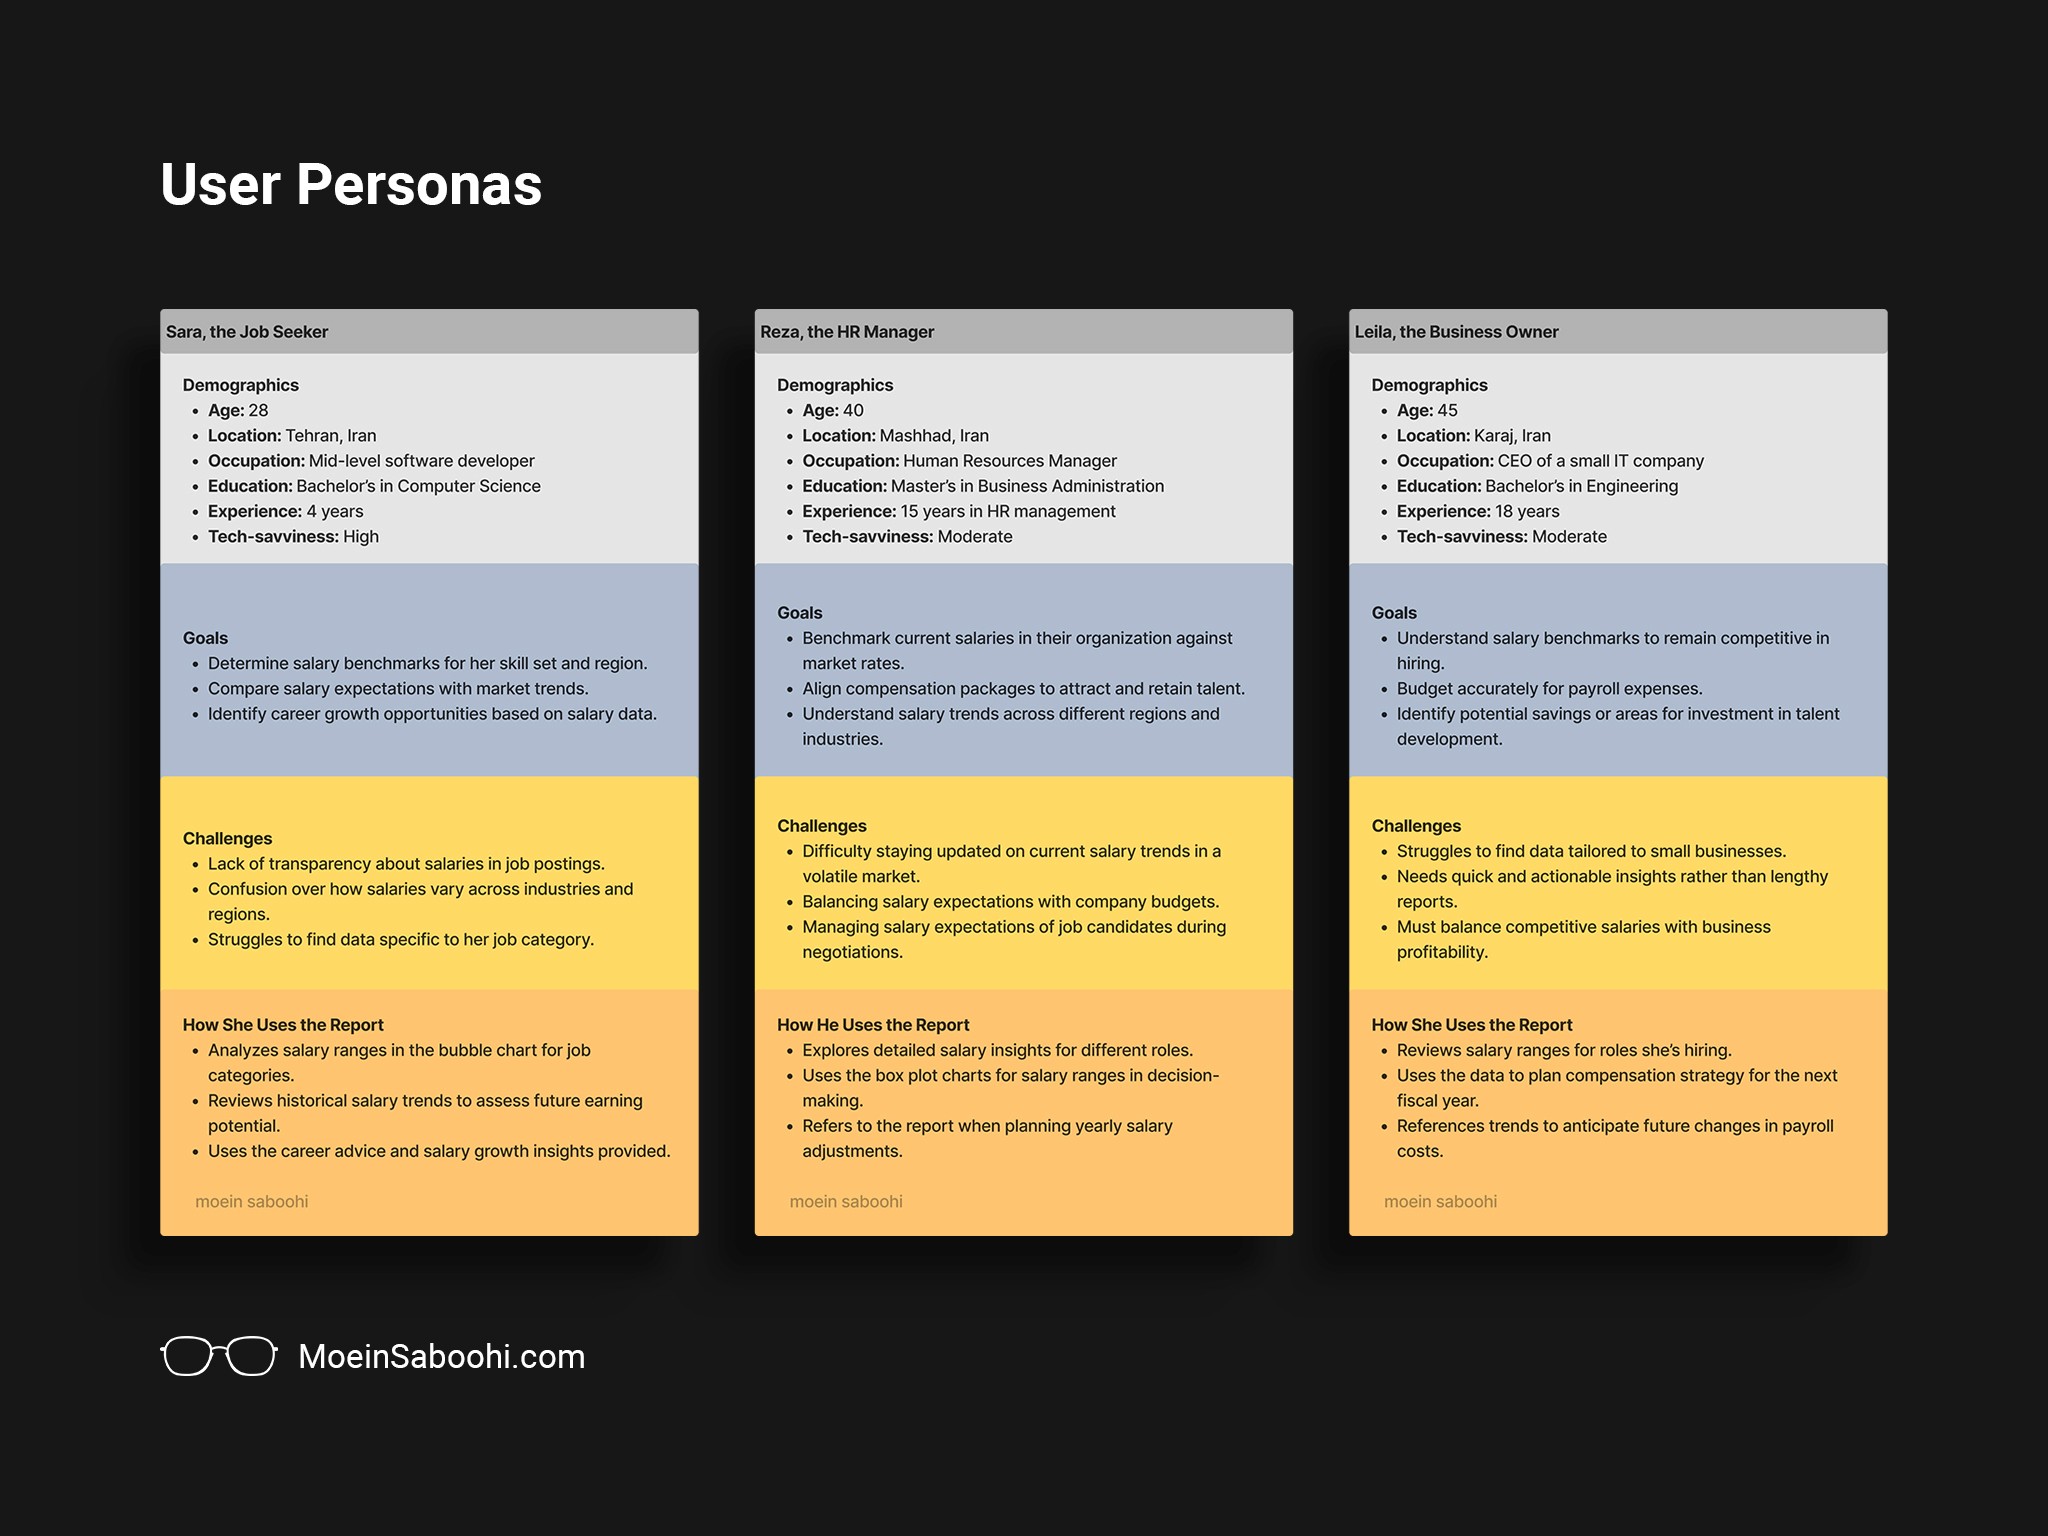
User Personas
To fully understand the needs and expectations of our audience, I developed three user personas based on user research:
Job Seeker: An individual actively searching for job opportunities.
HR Manager: Responsible for setting salaries and negotiating with candidates.
Employer (C-level): Interested in industry benchmarks to attract top talent.
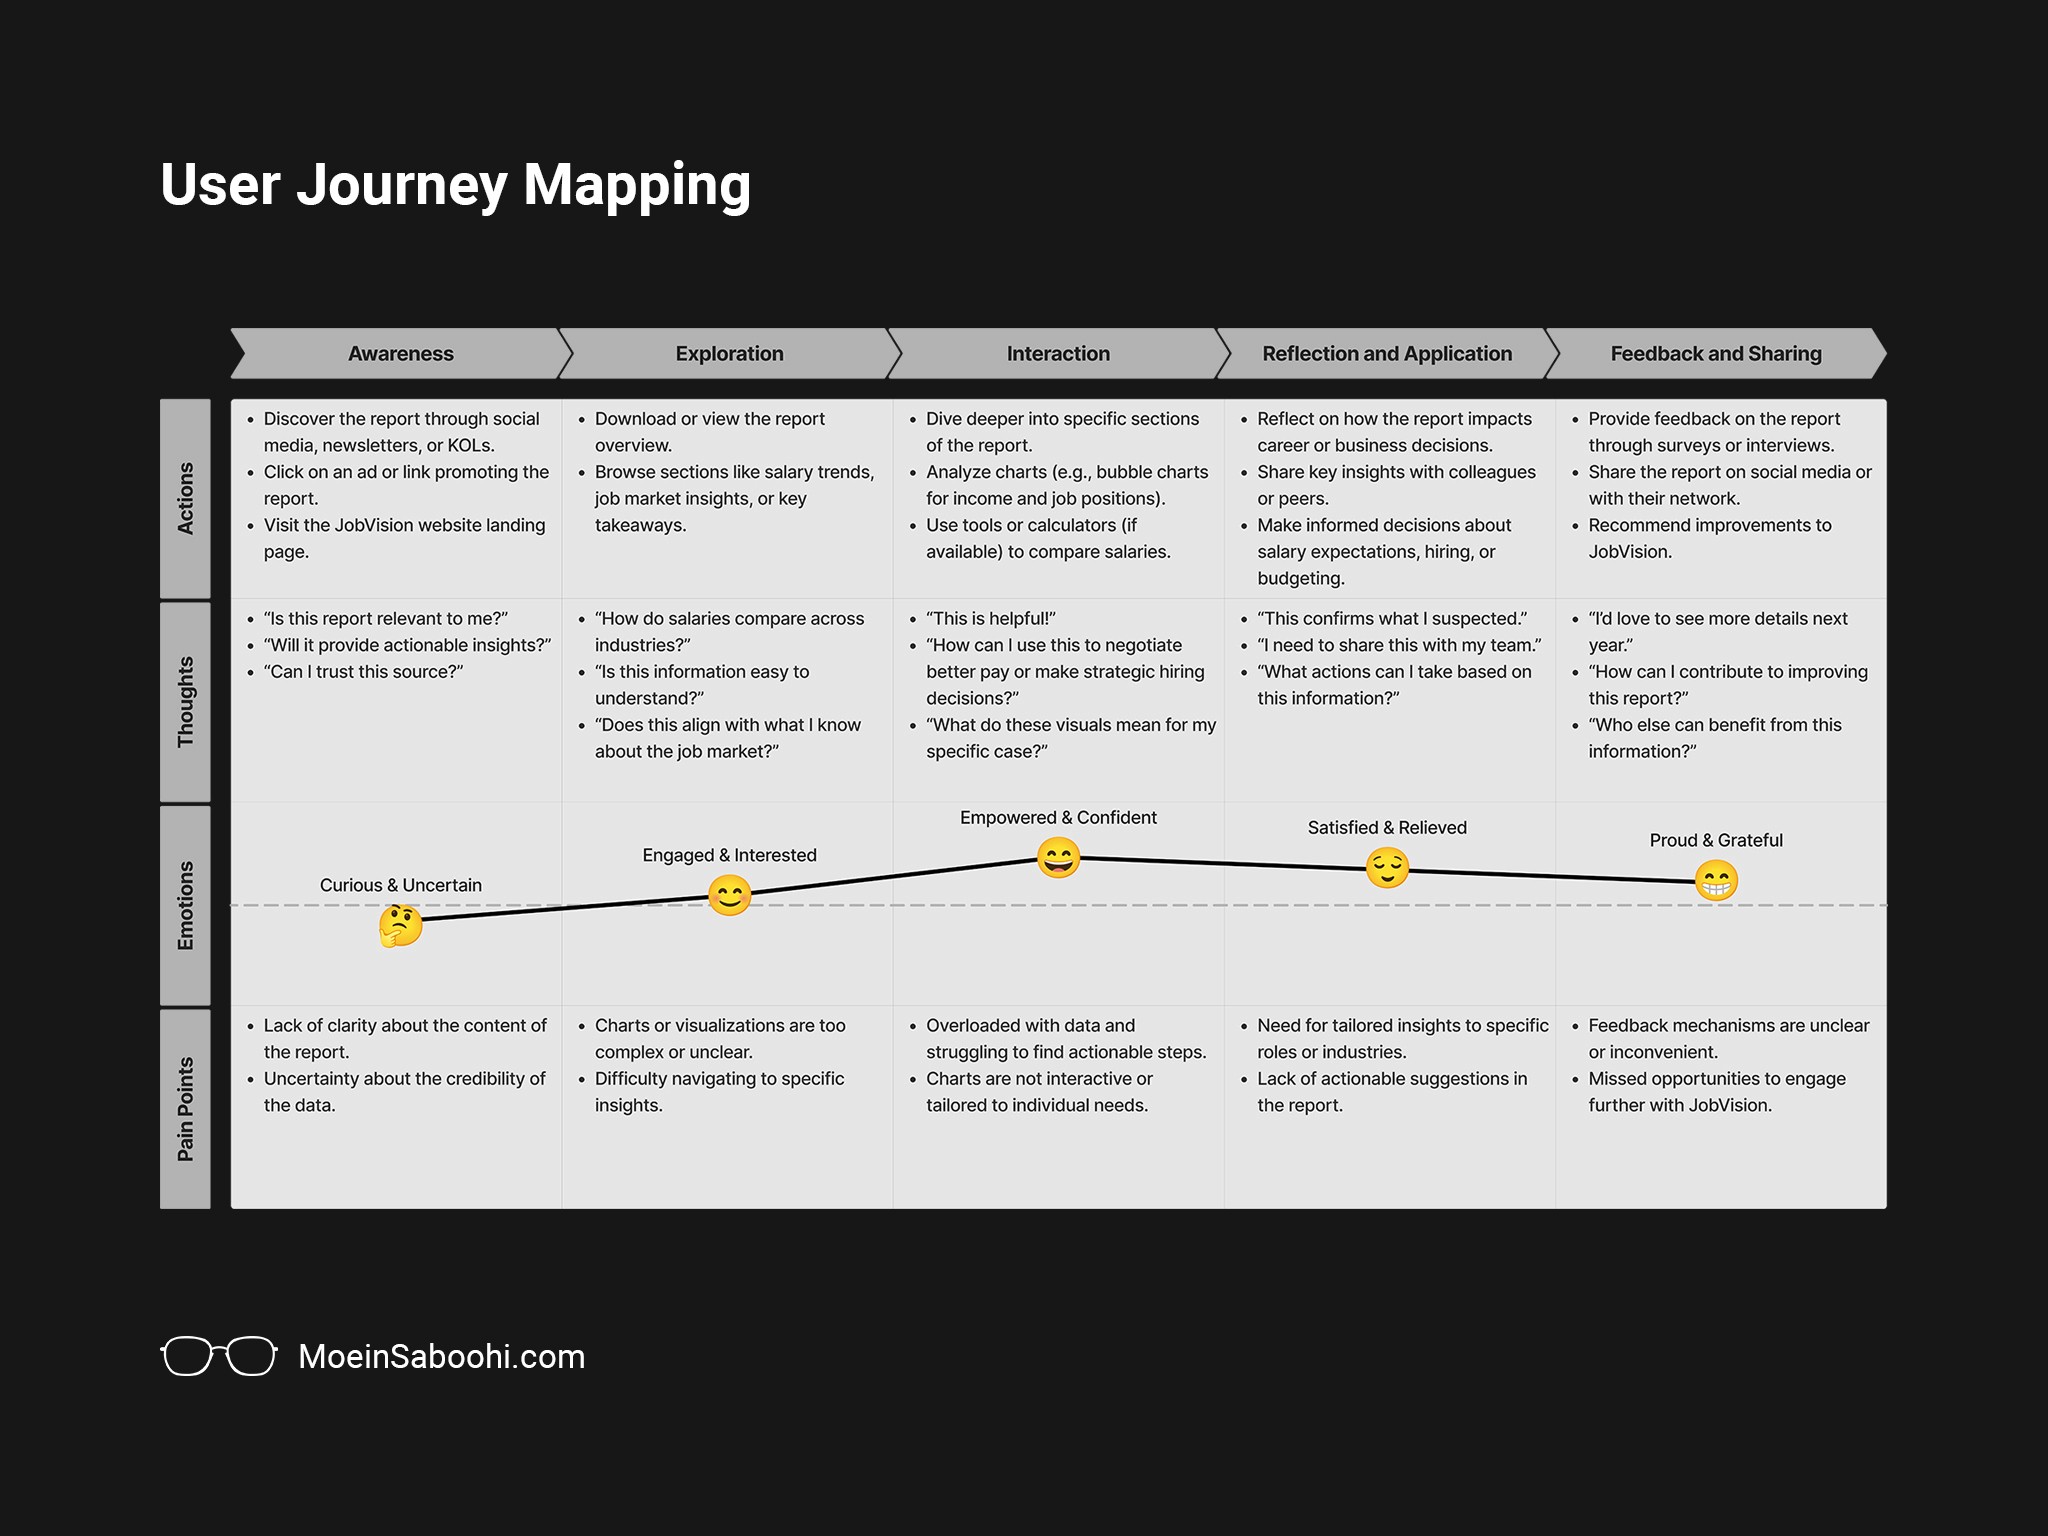
User Journey Mapping
The user journey map revealed key touchpoints where users interacted with the salary report, emphasizing their need for quick, job-specific salary insights. To address this, the report design incorporated:
Simplified Navigation: Recognizing the diverse needs of users across different regions, geographic areas were grouped into three intuitive categories:
Capital (e.g., Tehran): For users seeking insights relevant to the largest job market.
Major Cities: Focused on regional hubs with significant employment opportunities.
Small Cities: Tailored for users in less populated areas to ensure inclusivity.Improved Accessibility: Clear categorization reduced redundancy and allowed users to locate relevant data faster, addressing pain points discovered during the exploration and interaction stages of the journey map.
This user-centric approach ensured a seamless experience, empowering users to access actionable insights with ease.
International Benchmarks
I analyzed how similar reports and platforms address salary data in other countries. Five notable examples included:

Glassdoor Salary Insights
Interactive Salary Explorer: Users can input job titles and locations to receive personalized salary estimates, enhancing user engagement.
Salary Distribution Graphs: Visual representations, such as histograms, display salary ranges for specific roles, aiding users in understanding market positioning.
Company Comparison Tables: Side-by-side salary comparisons across companies for similar roles, facilitating informed career decisions.

Payscale’s Salary Report
Customized Salary Reports: Users receive personalized salary reports based on their job title, experience, and location, presented with clear visuals.
Trend Analysis Graphs: Line charts illustrate salary trends over time, helping users understand market dynamics.
Compensation Components Breakdown: Pie charts detail the composition of total compensation, including base salary, bonuses, and benefits.

Indeed Salary Trends
Salary Trend Graphs: Line graphs display changes in salary averages over time for various roles, providing insights into market trends.
Job Postings with Salary Information: Highlights the percentage of job postings that include salary data, promoting transparency.
Regional Salary Comparisons: Maps and charts compare salary averages across different locations, aiding geographic career planning.
Business Needs
Providing a salary reference: Help job seekers and employers make informed decisions.
Brand Awareness: Establish JobVision as a reliable source for salary insights.
Market Growth: Attract a larger share of the recruitment market.
JobVision aimed to offer a reliable salary reference, boost brand awareness, and expand market reach. The design focused on clarity, efficiency, and scalability for easy access, quick insights, and future flexibility.
Design Goals
Clarity: Ensure all users, regardless of expertise, could understand the data.
Efficiency: Design the report so users can quickly find job-specific insights.
Scalability: Create a flexible system that could accommodate future changes and expansions.
Working Towards A Solution
The solution streamlined data into clear sections, optimized user flow, and tested interactive charts. Usability tests showed 75% accuracy for HR managers and quick data access for 70% of users.
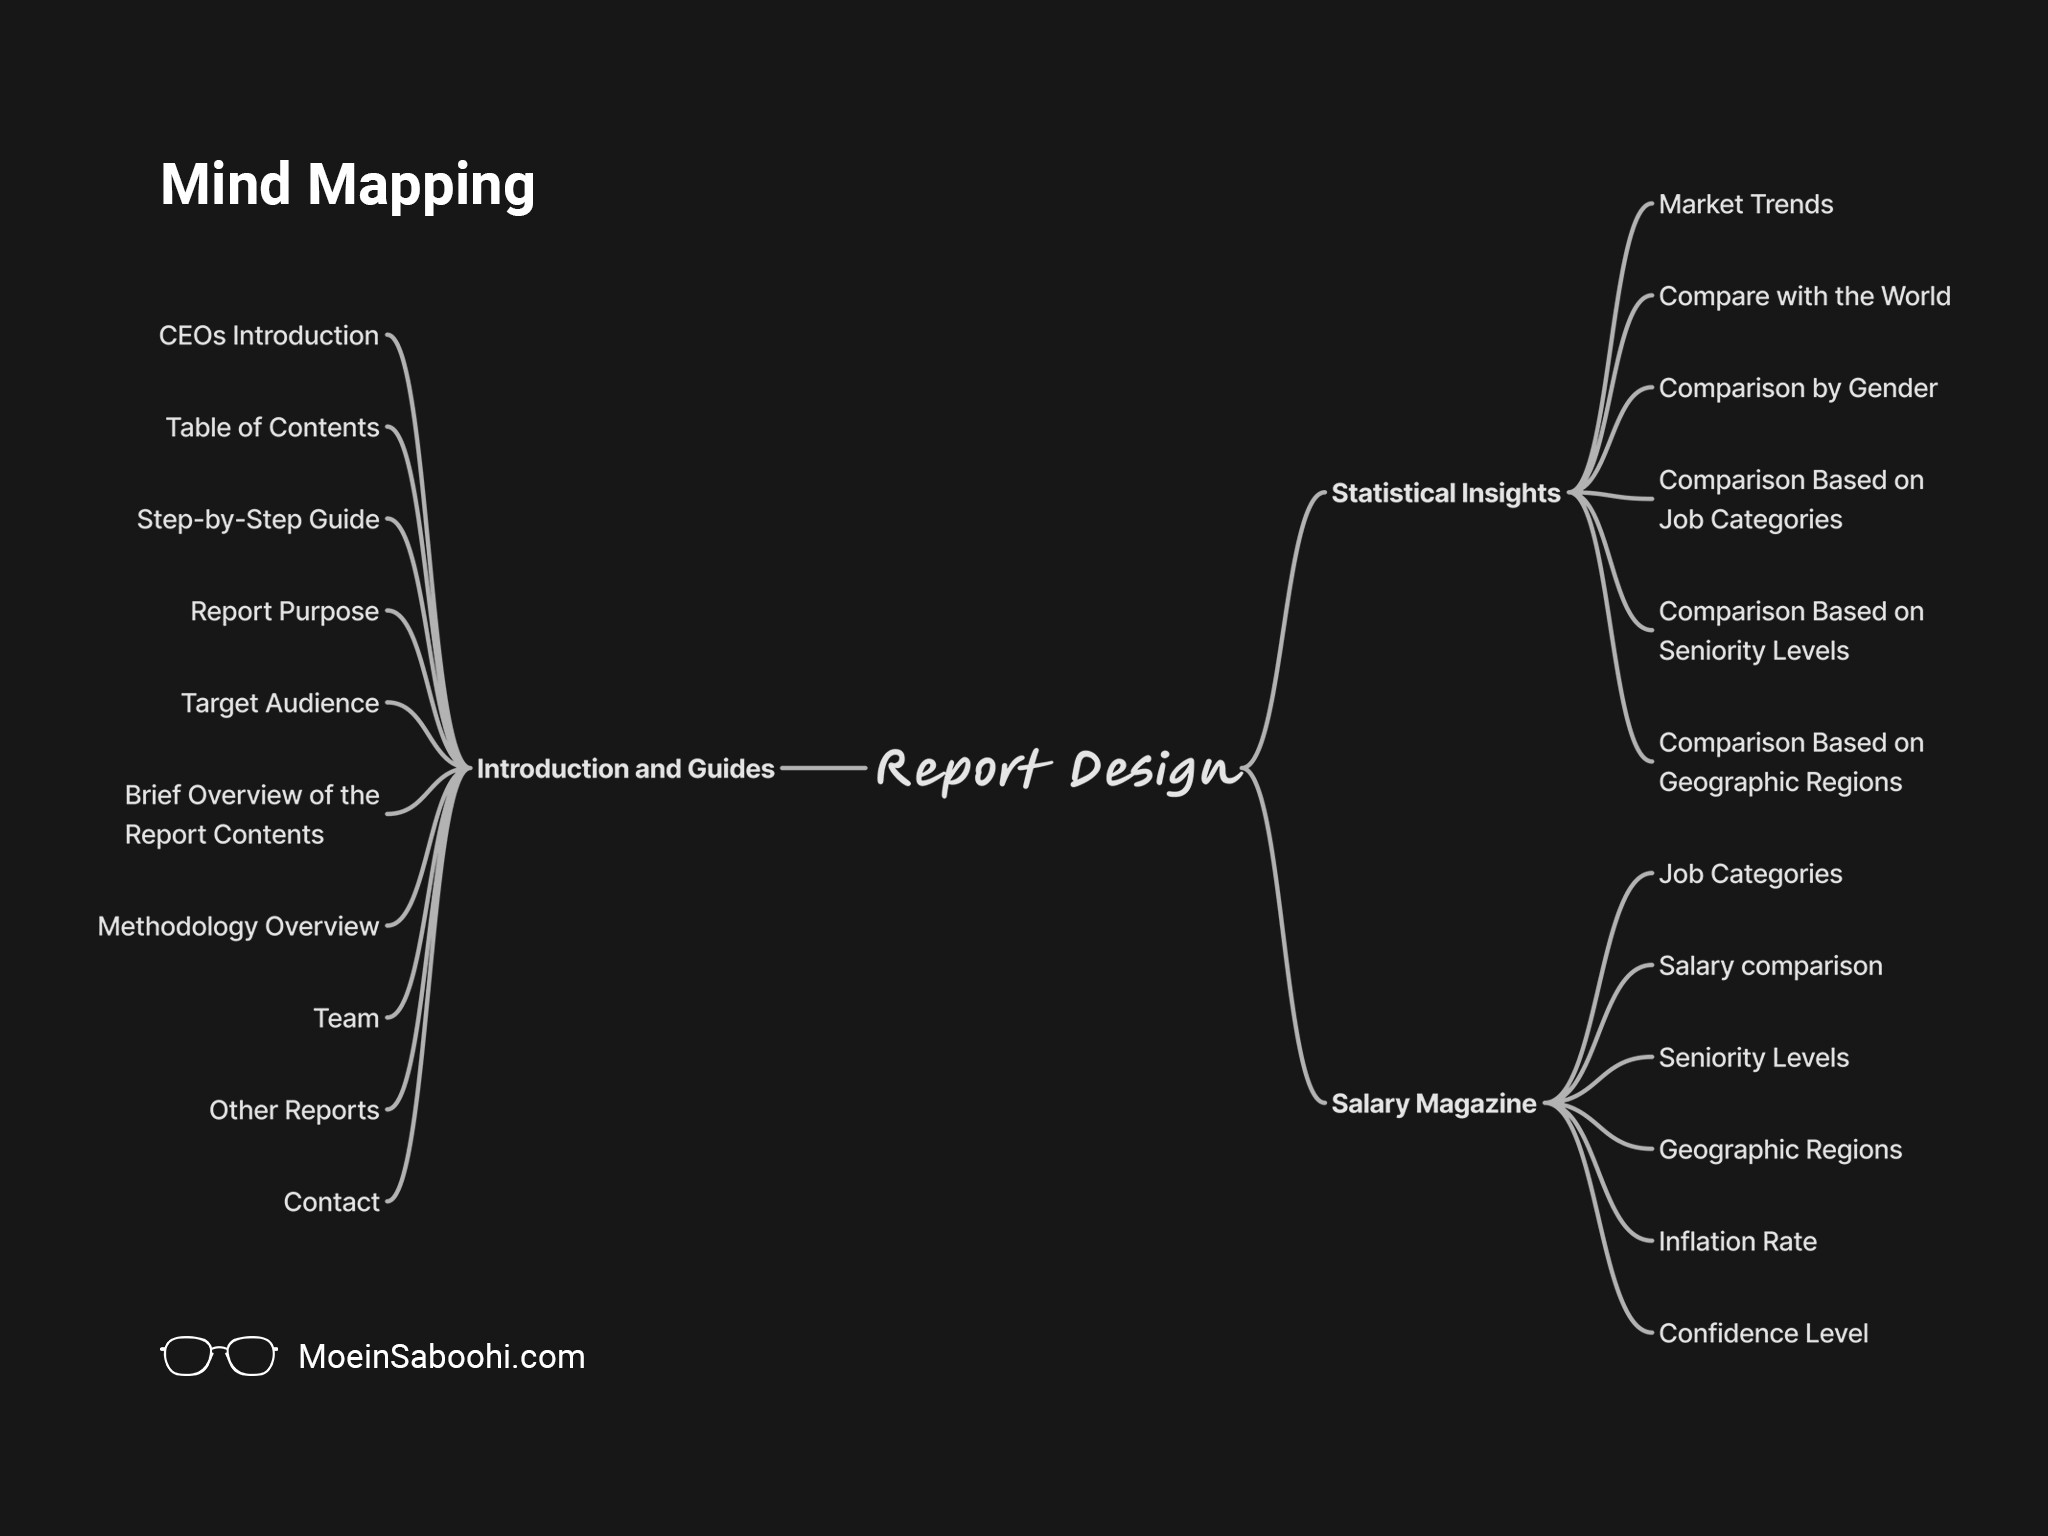
Ideation
I began with mind mapping to categorize the data into three main sections:
Introduction and Guides: Providing context about the report and its methodology.
Statistical Insights: Key data visualizations for market trends and averages.
Salary Magazine: Detailed breakdowns for job categories, seniority levels, and geographic regions.
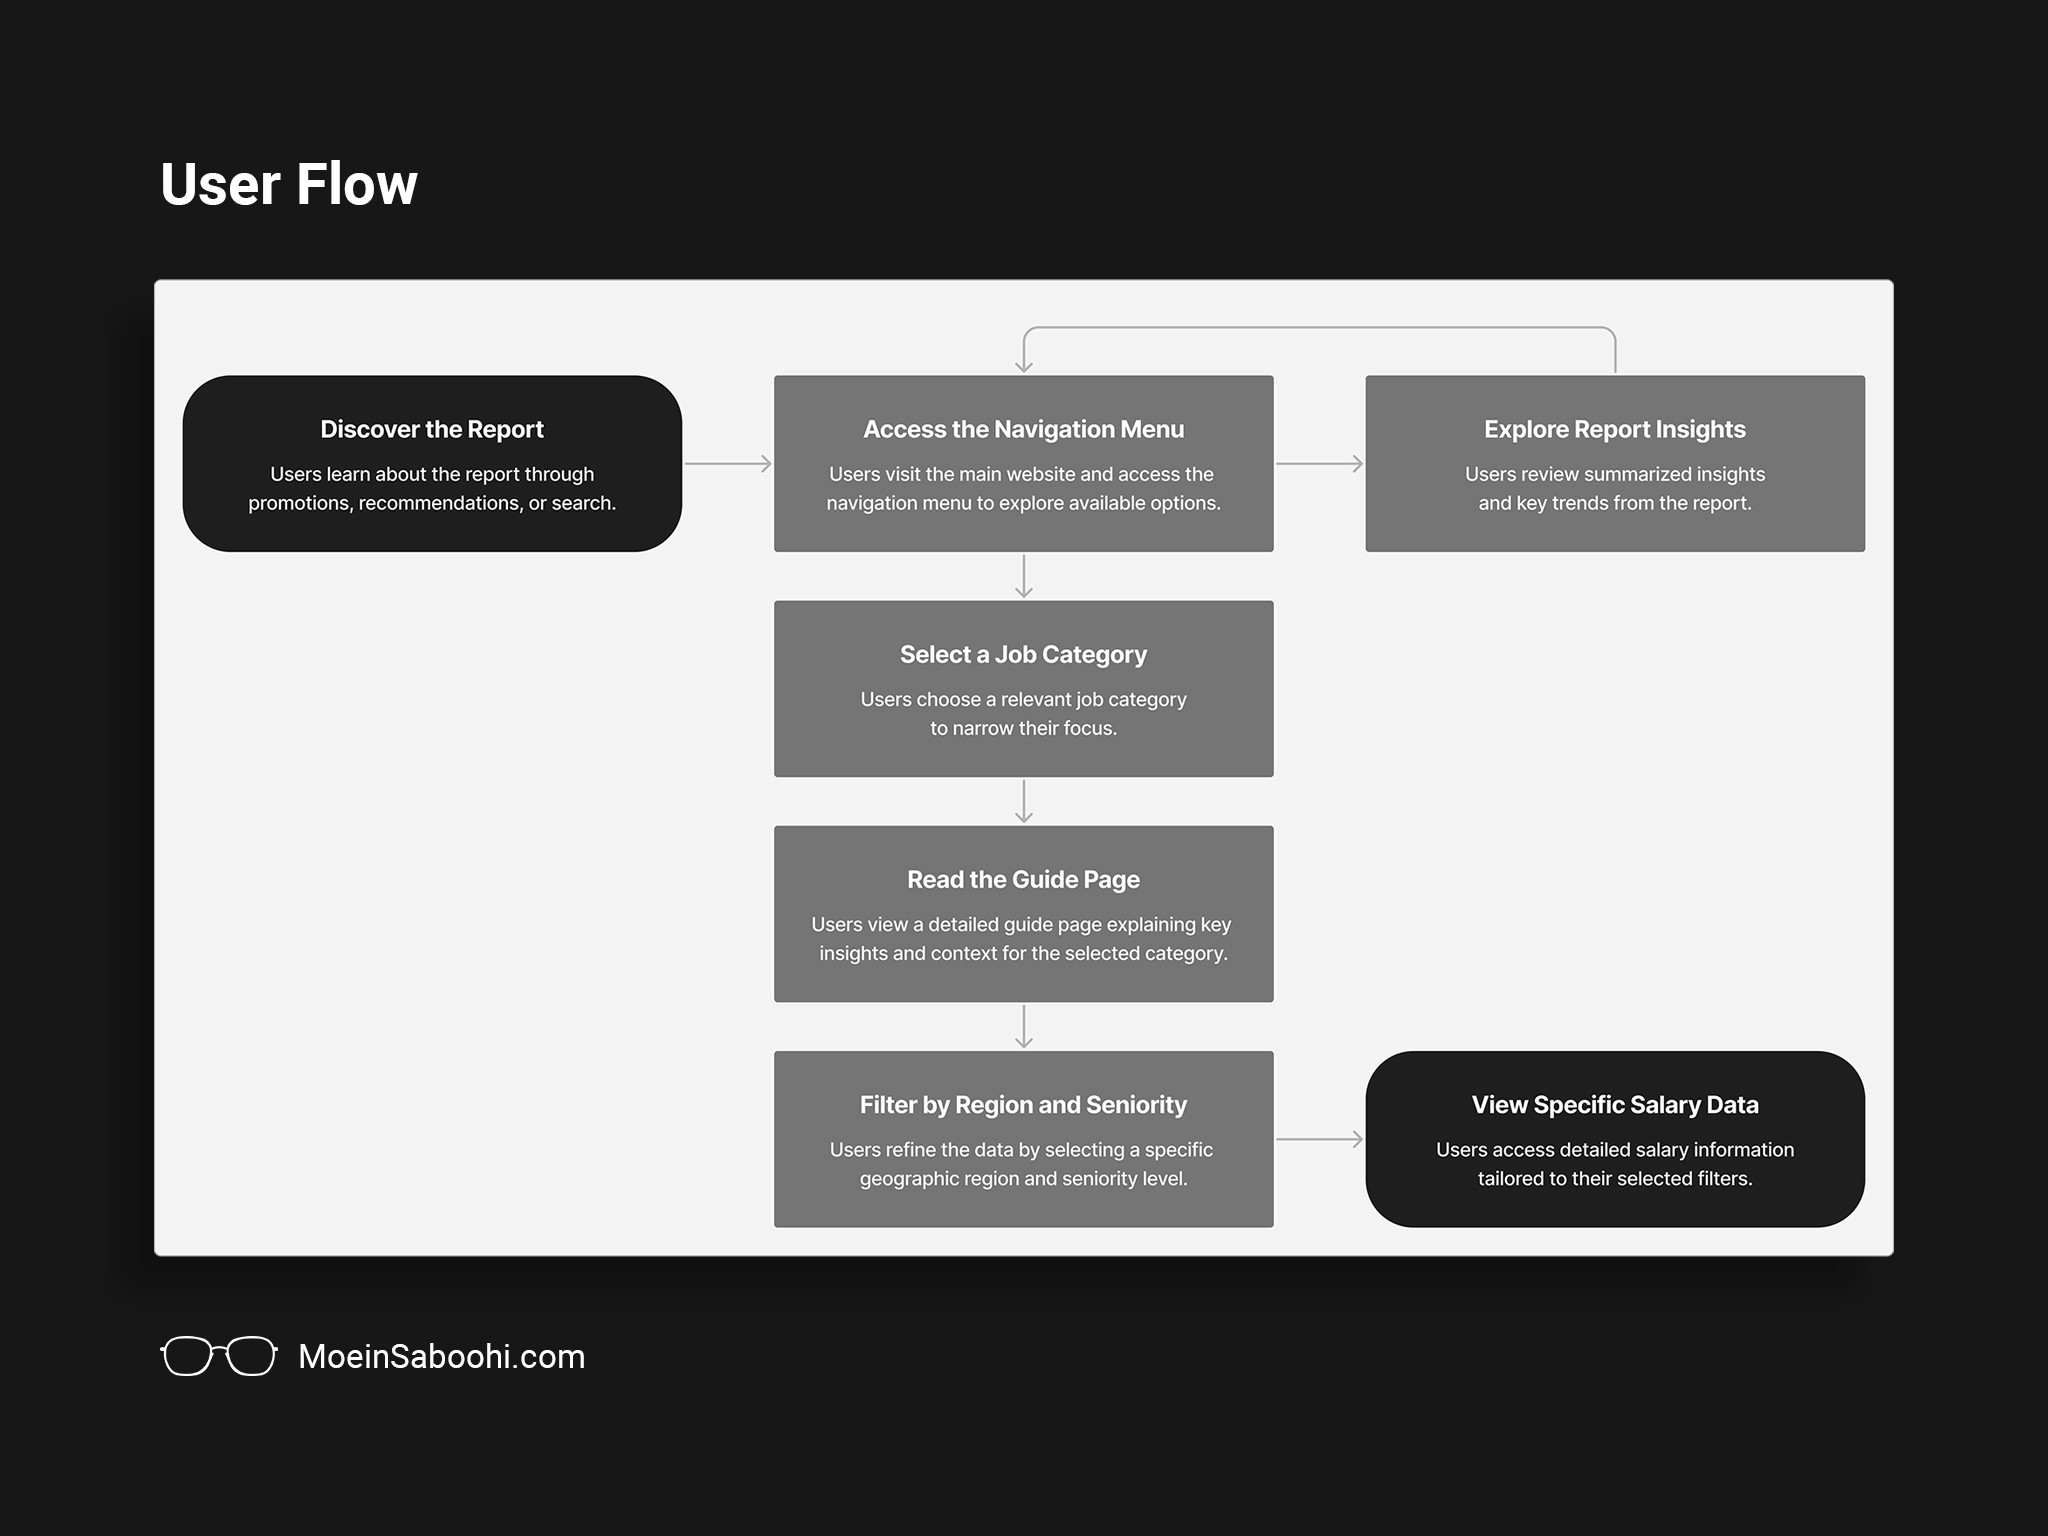
User Flow
By analyzing user needs and testing, we created a seamless experience that allowed users to effortlessly find the relevant salary information. The flow was structured to minimize effort, guiding users logically through the process to ensure they could quickly access detailed salary data. User feedback confirmed that the flow was intuitive and effective, meeting both job seekers and employers needs.
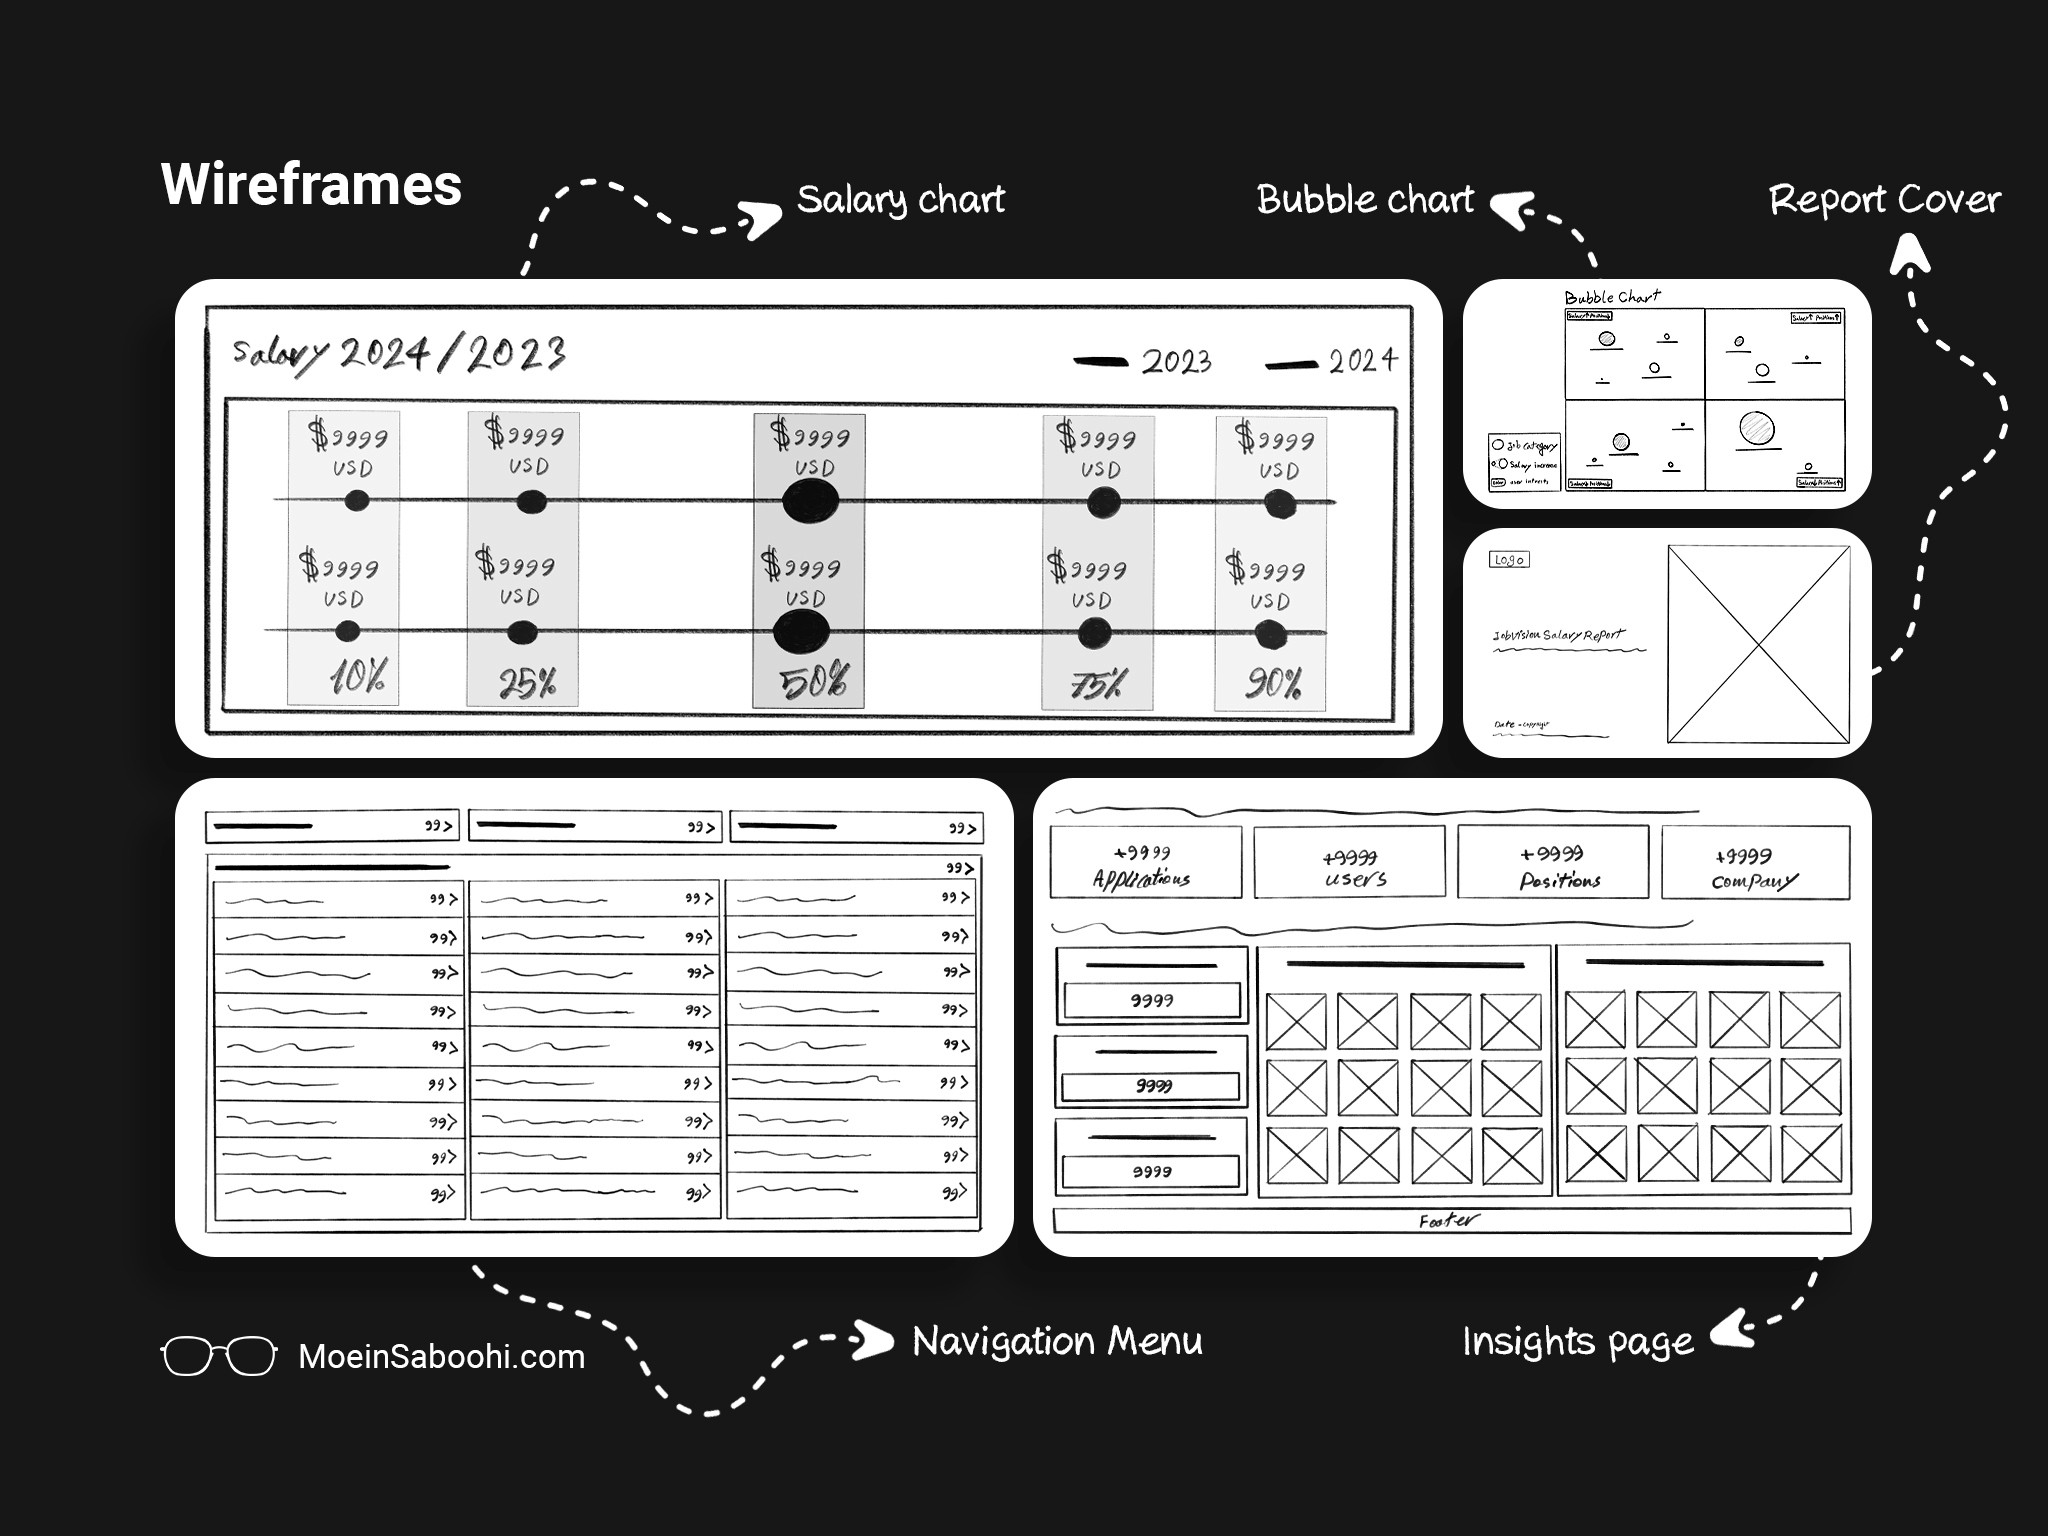
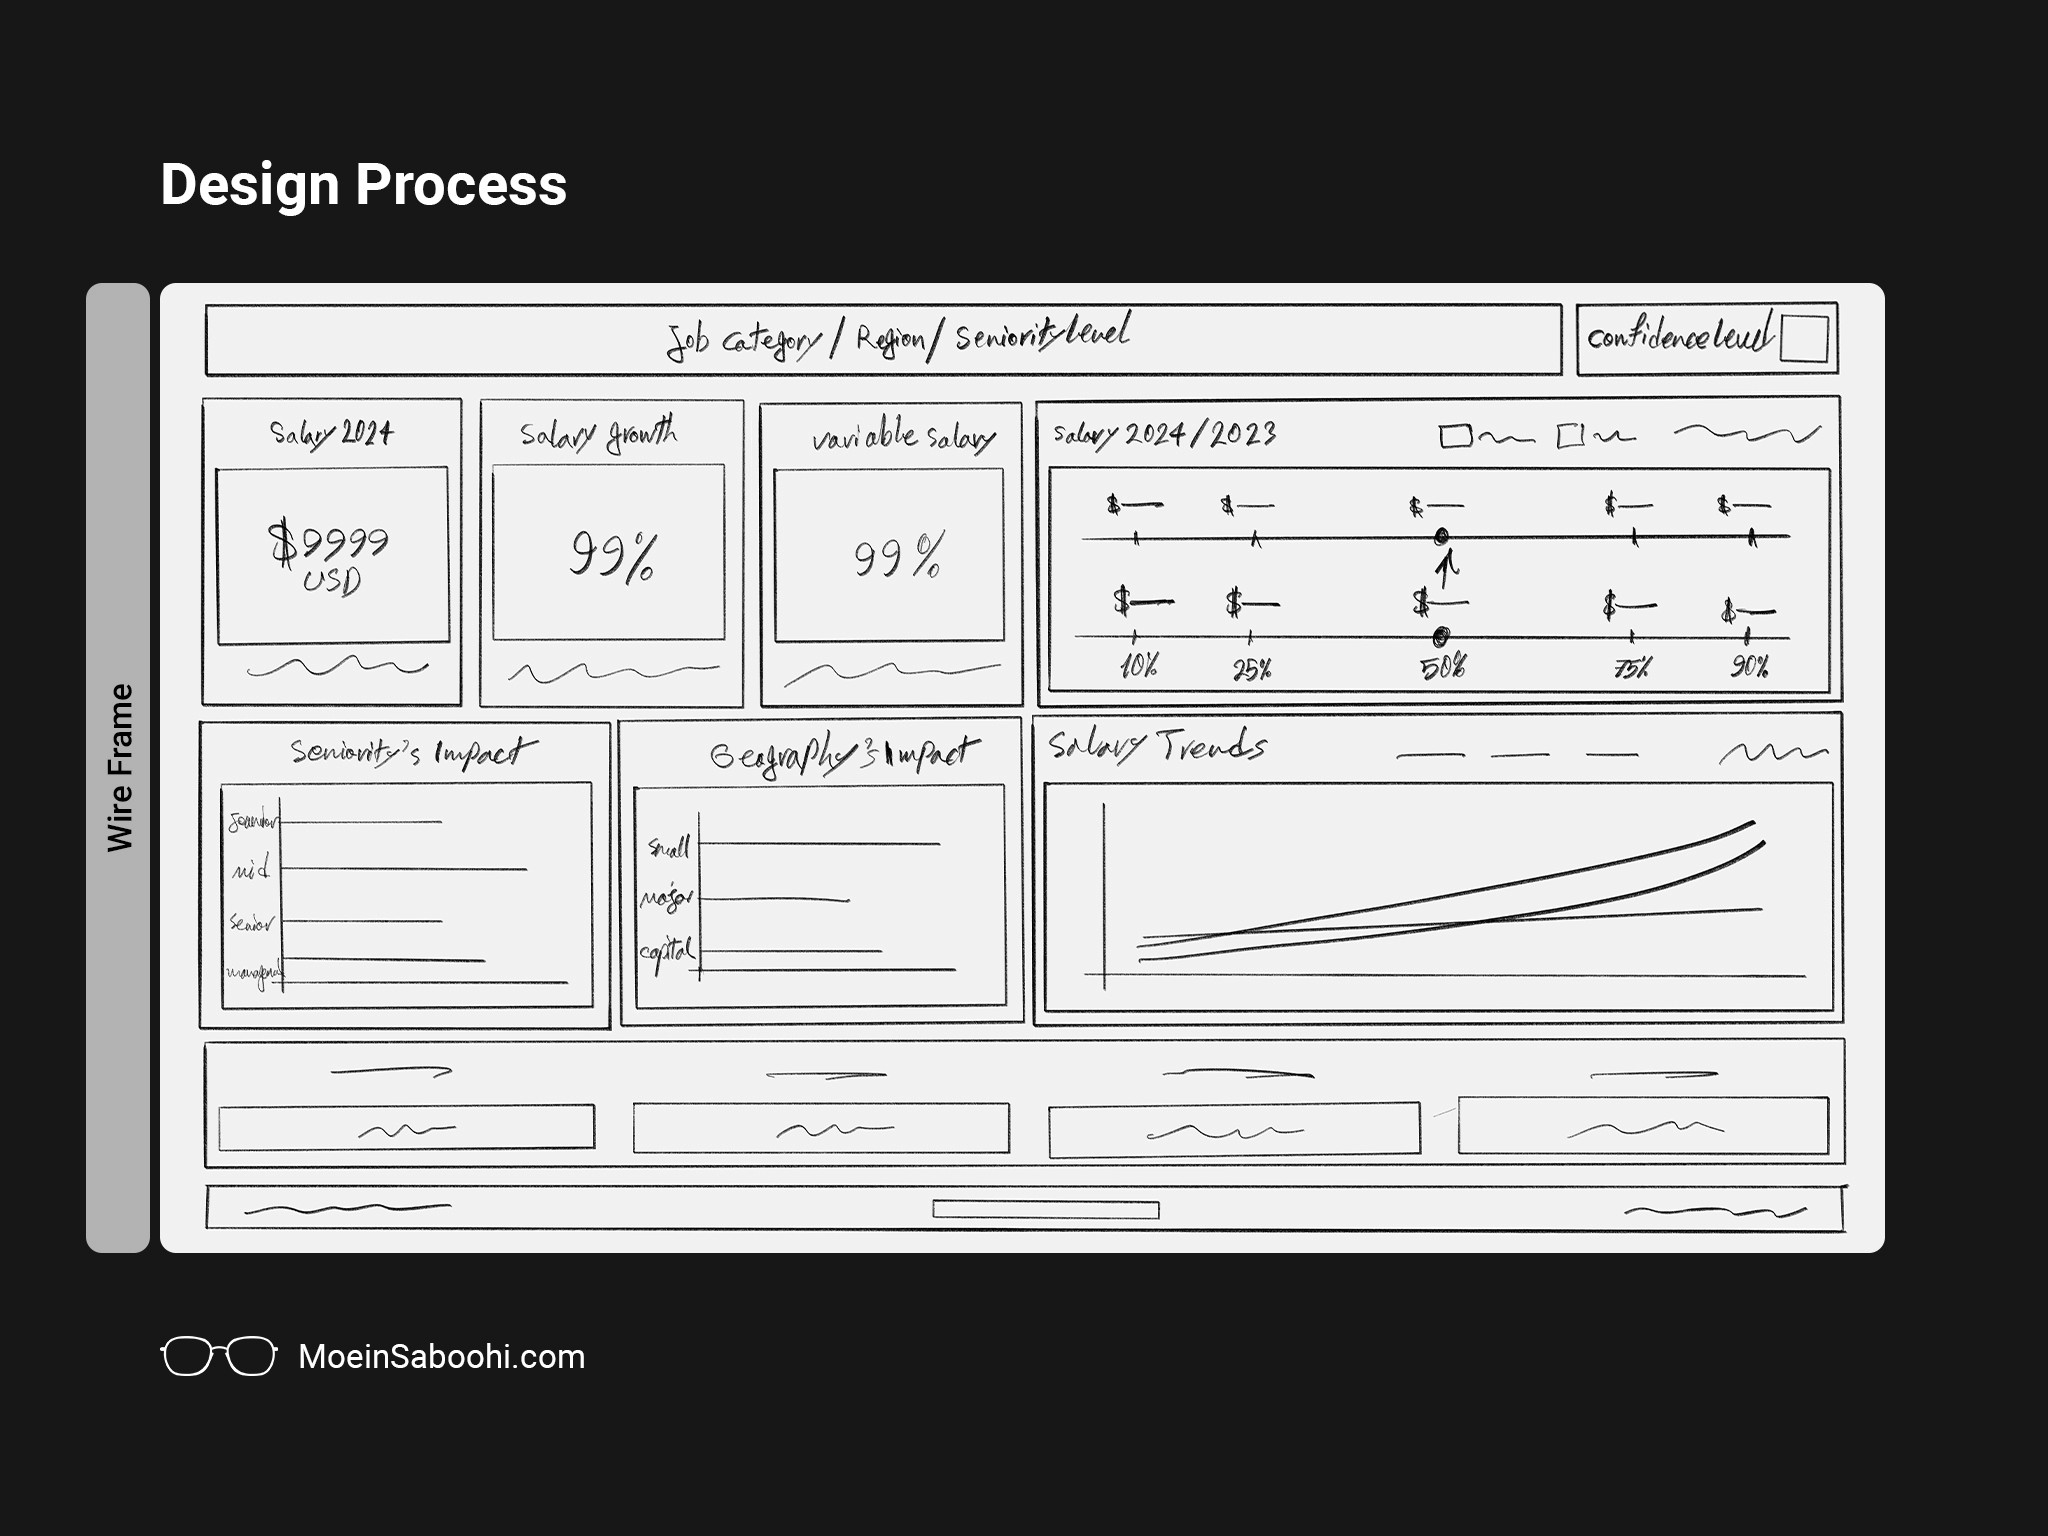
Wireframing
The wireframing process focused on creating a user-centered layout with clear navigation and a logical hierarchy to help users quickly access relevant information. Key sections like job categories and salary insights were organized to minimize cognitive load.
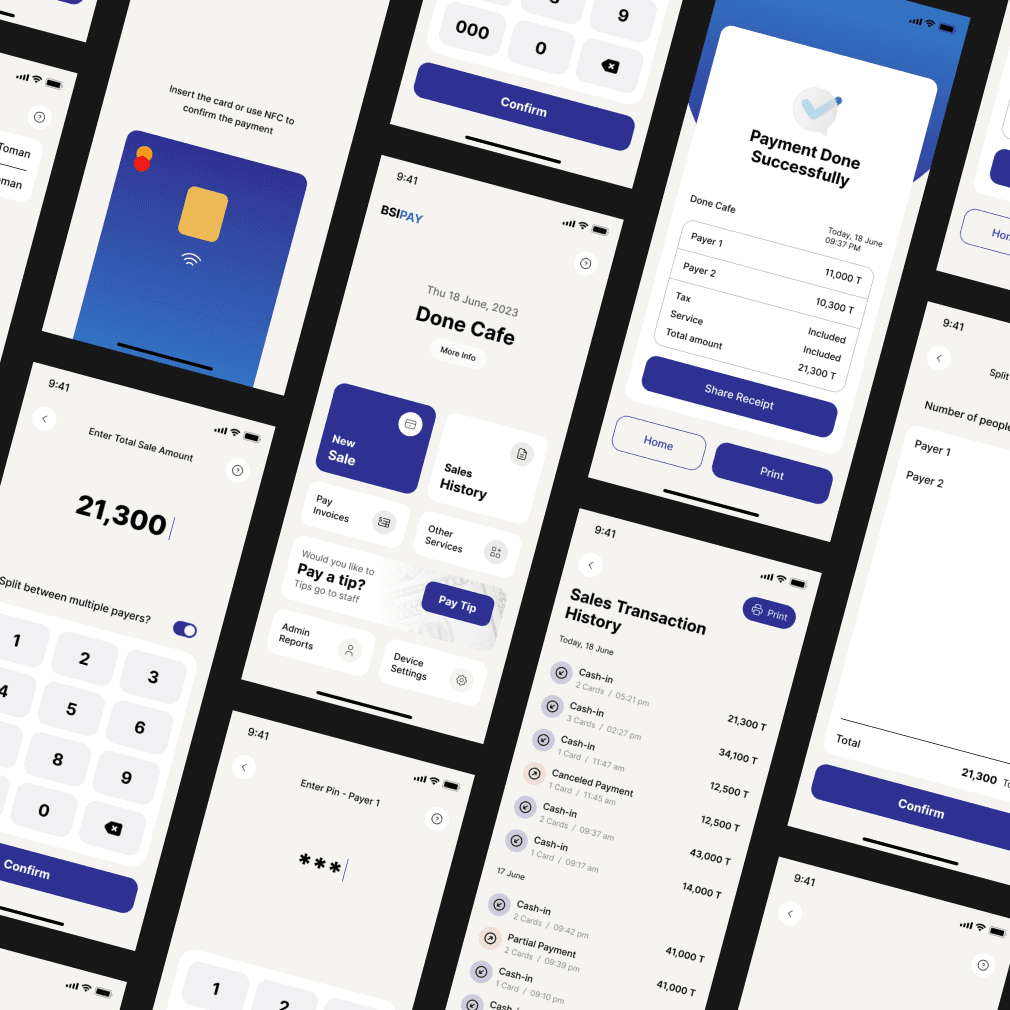
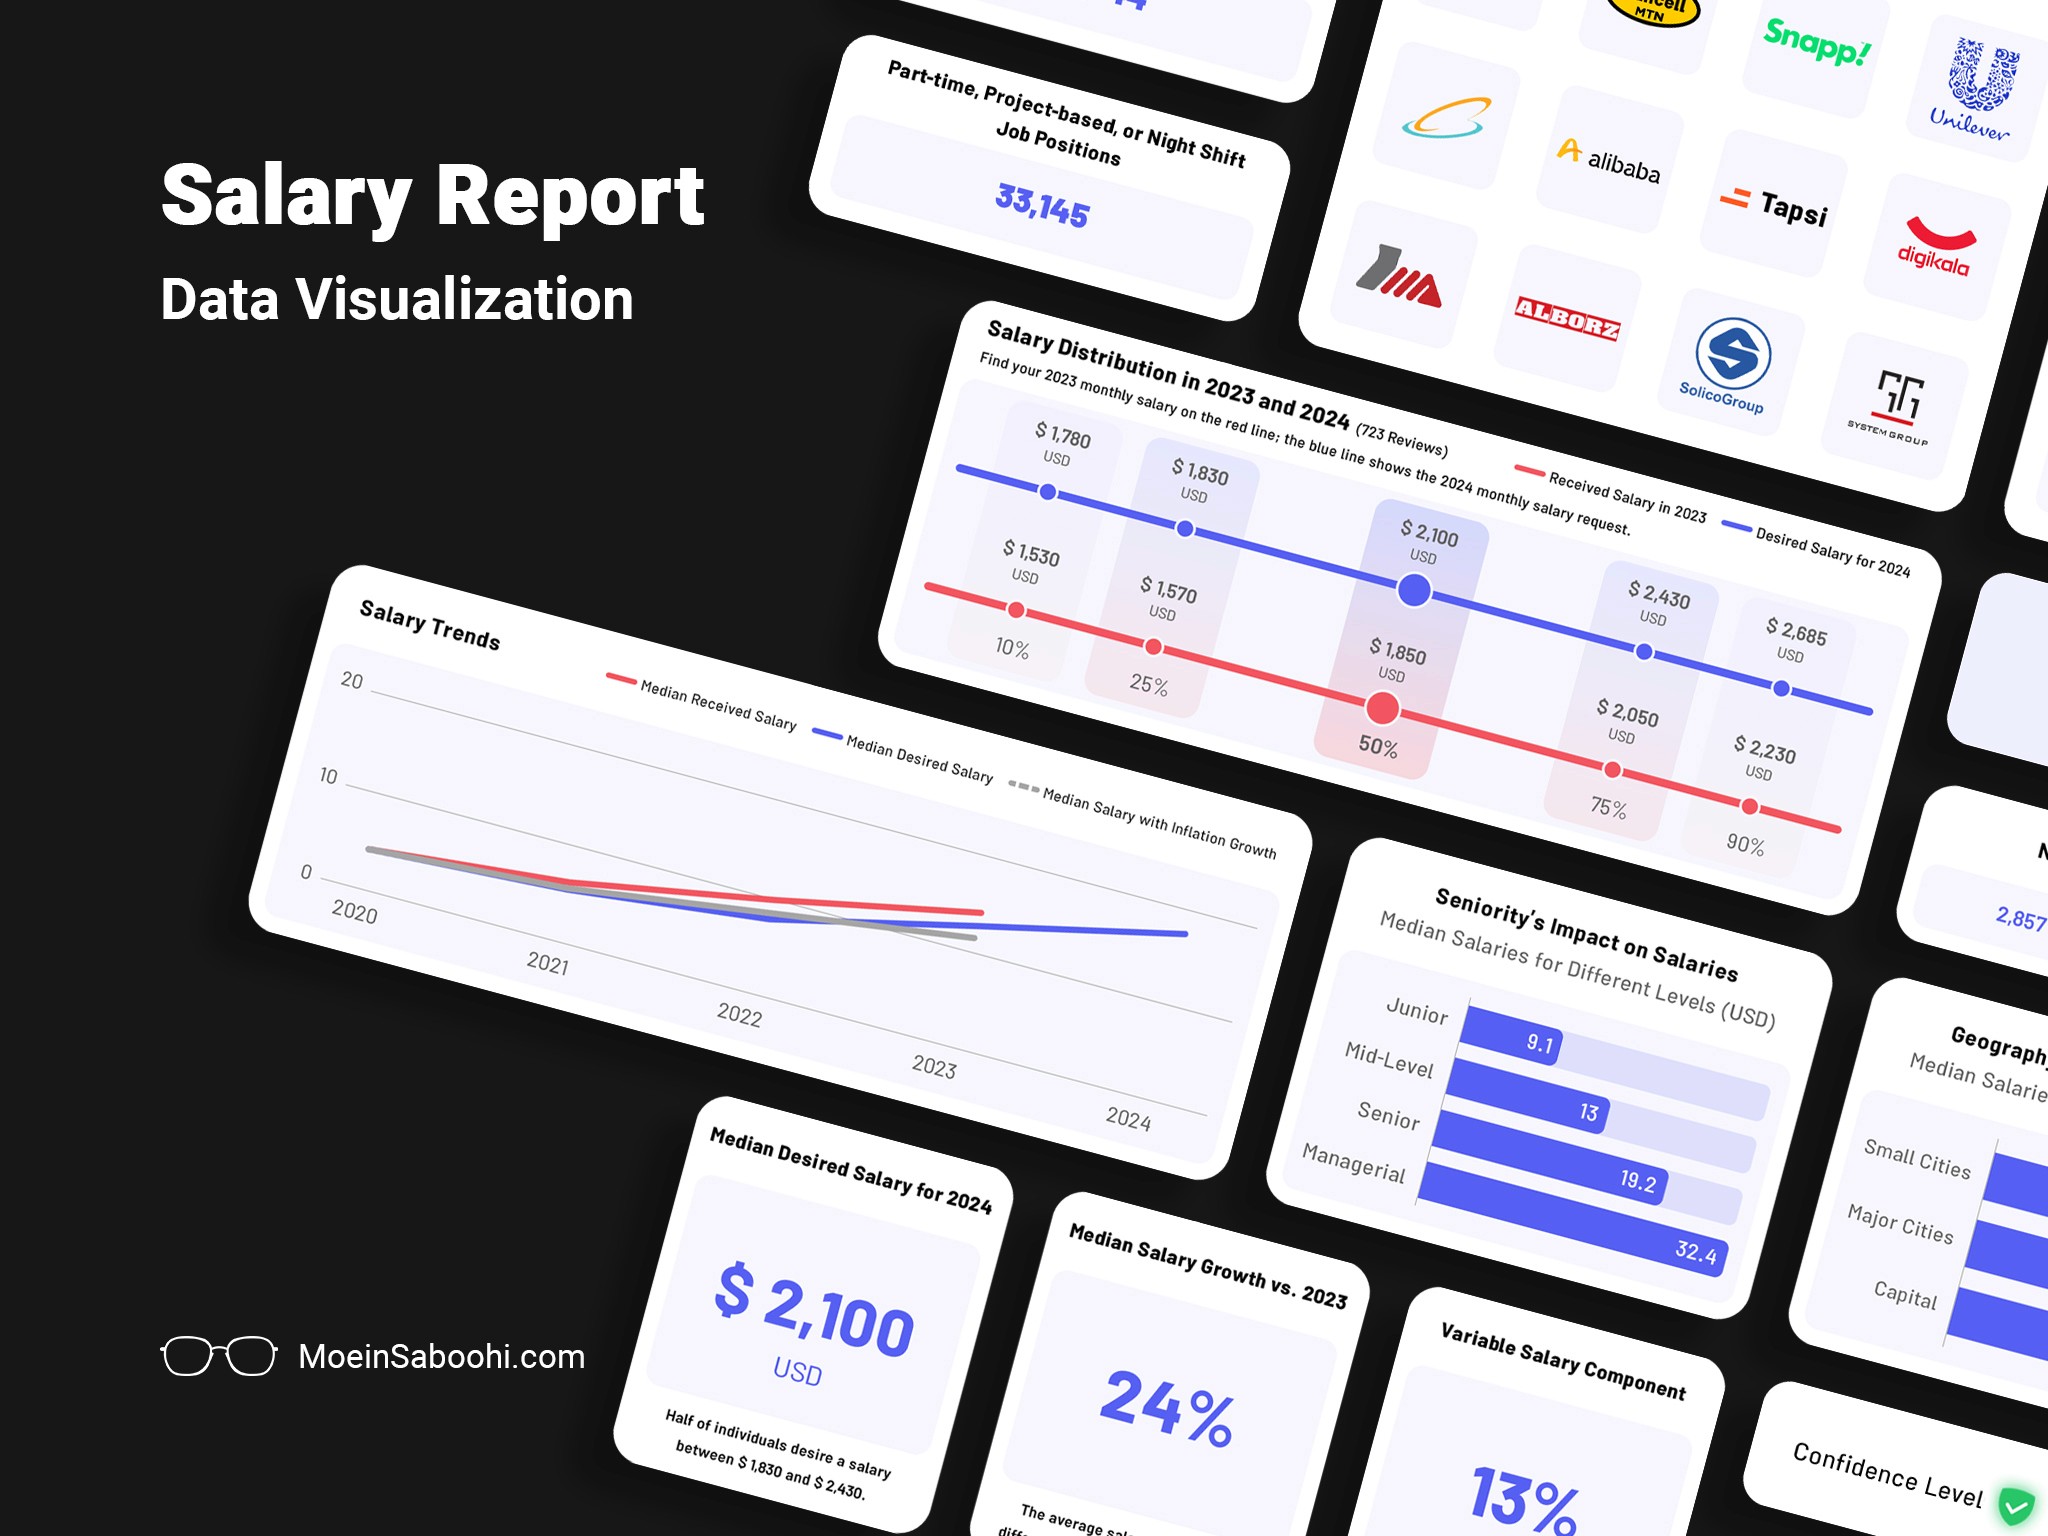
We also tested various chart types, including:
Box plots for visualizing salary ranges,
Bar charts and line graphs for trends like salary growth,
Bubble charts to illustrate the status of each job category by income level and the number of available positions.
These wireframes allowed early testing to ensure the final design effectively conveyed data, providing a solid foundation for the report’s user-focused experience.
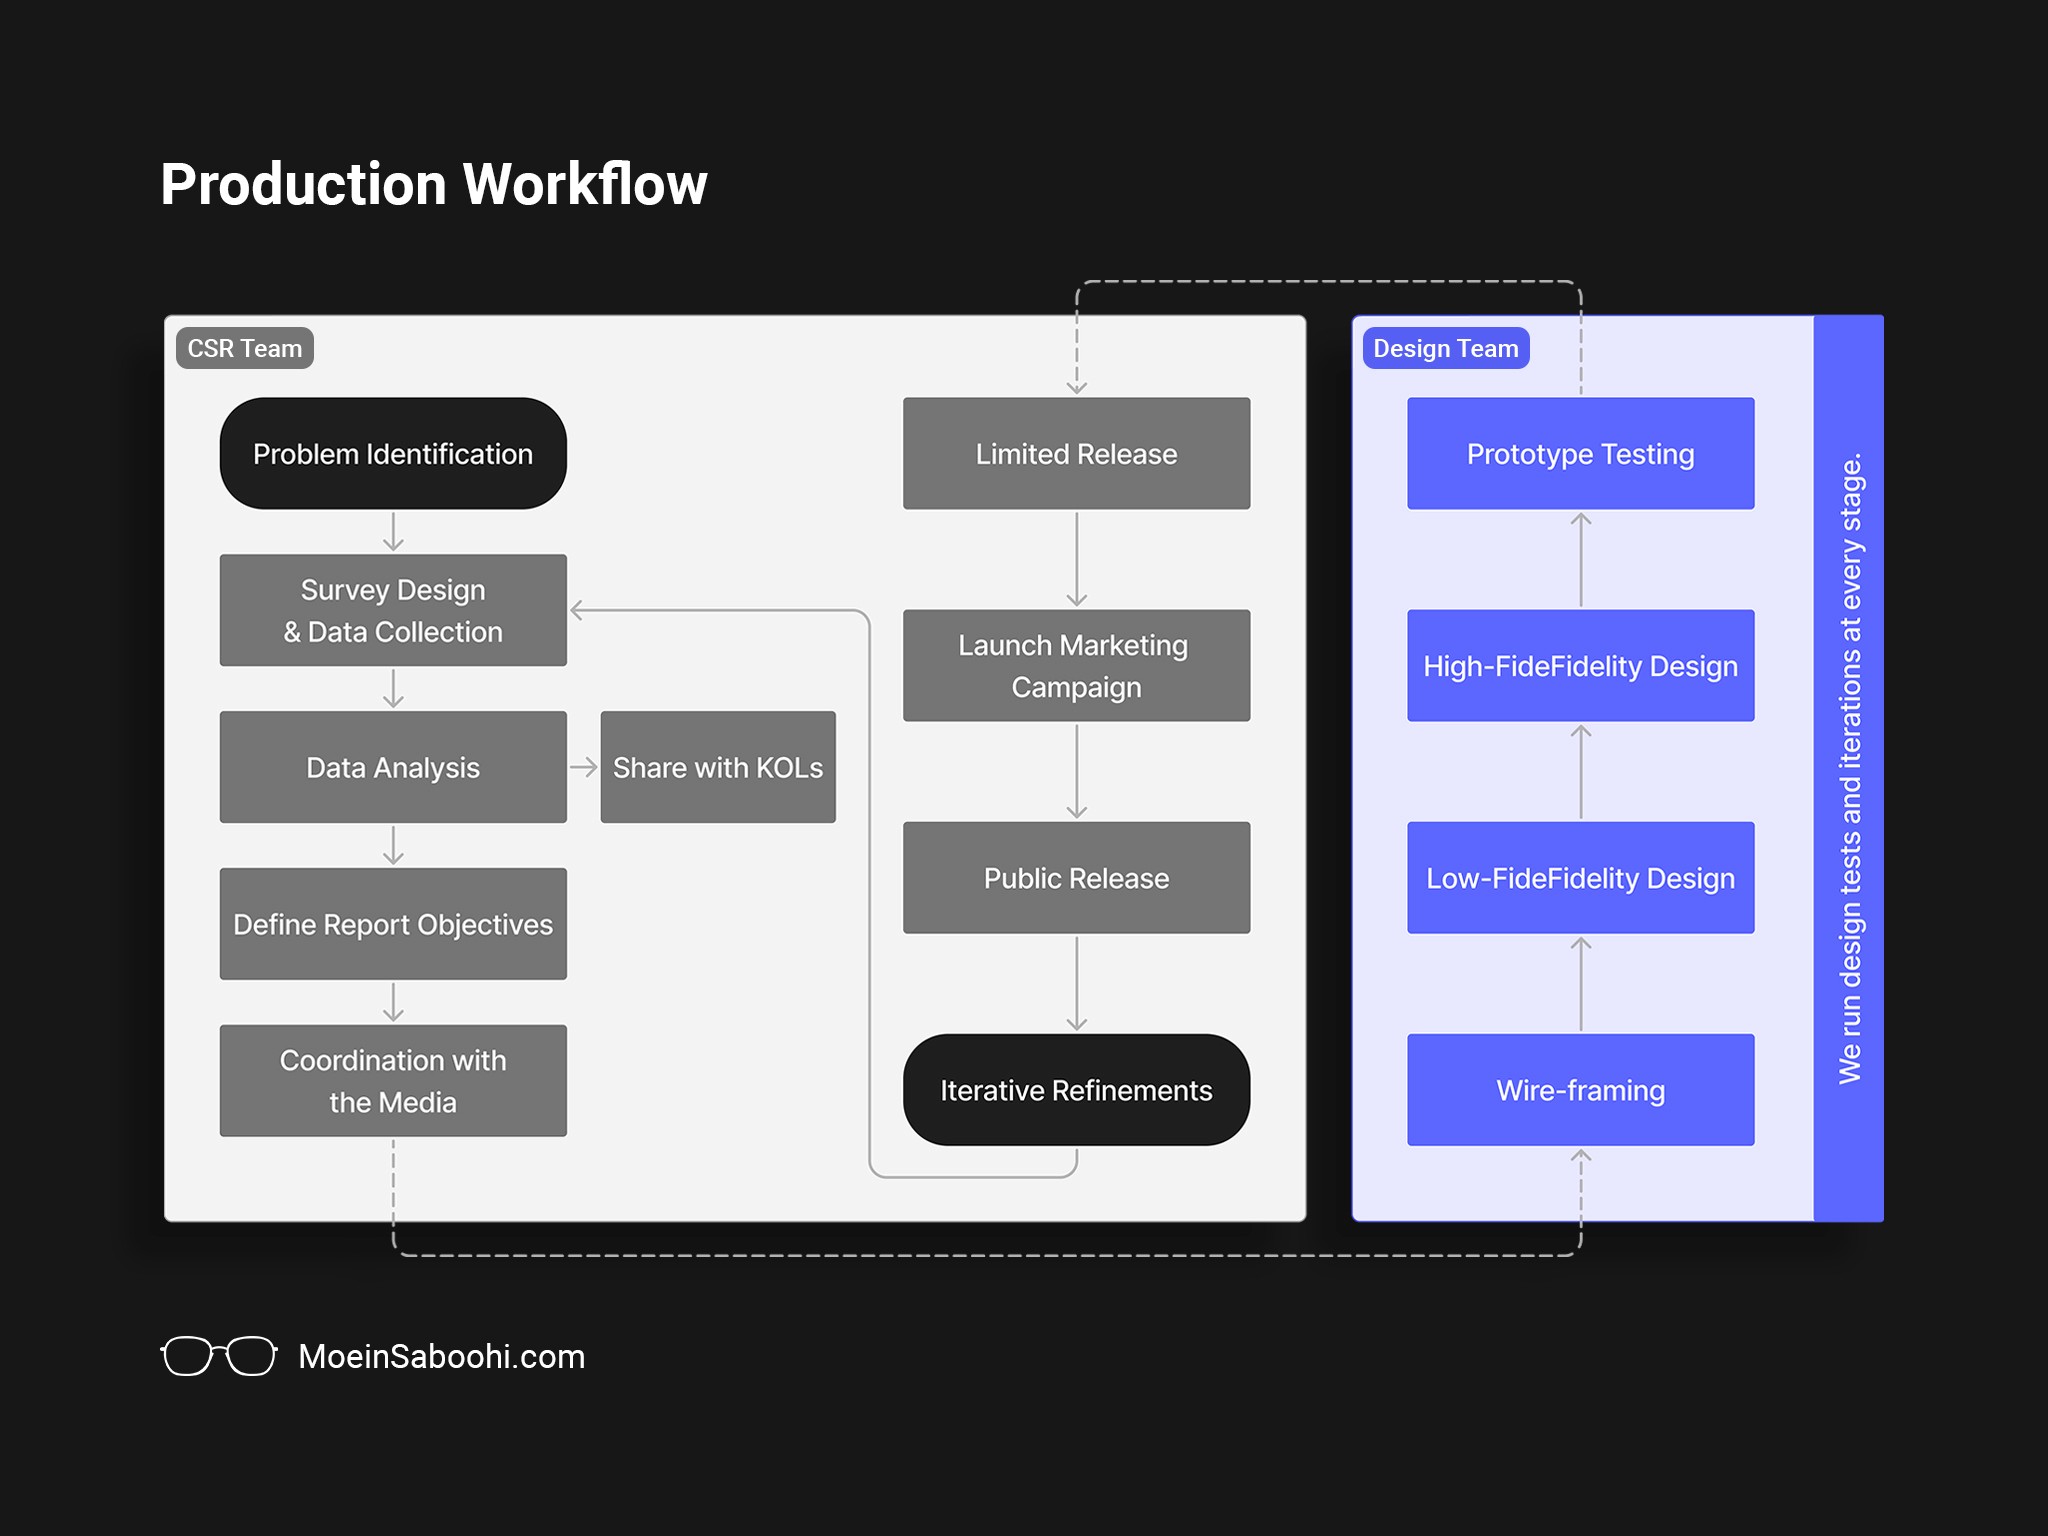
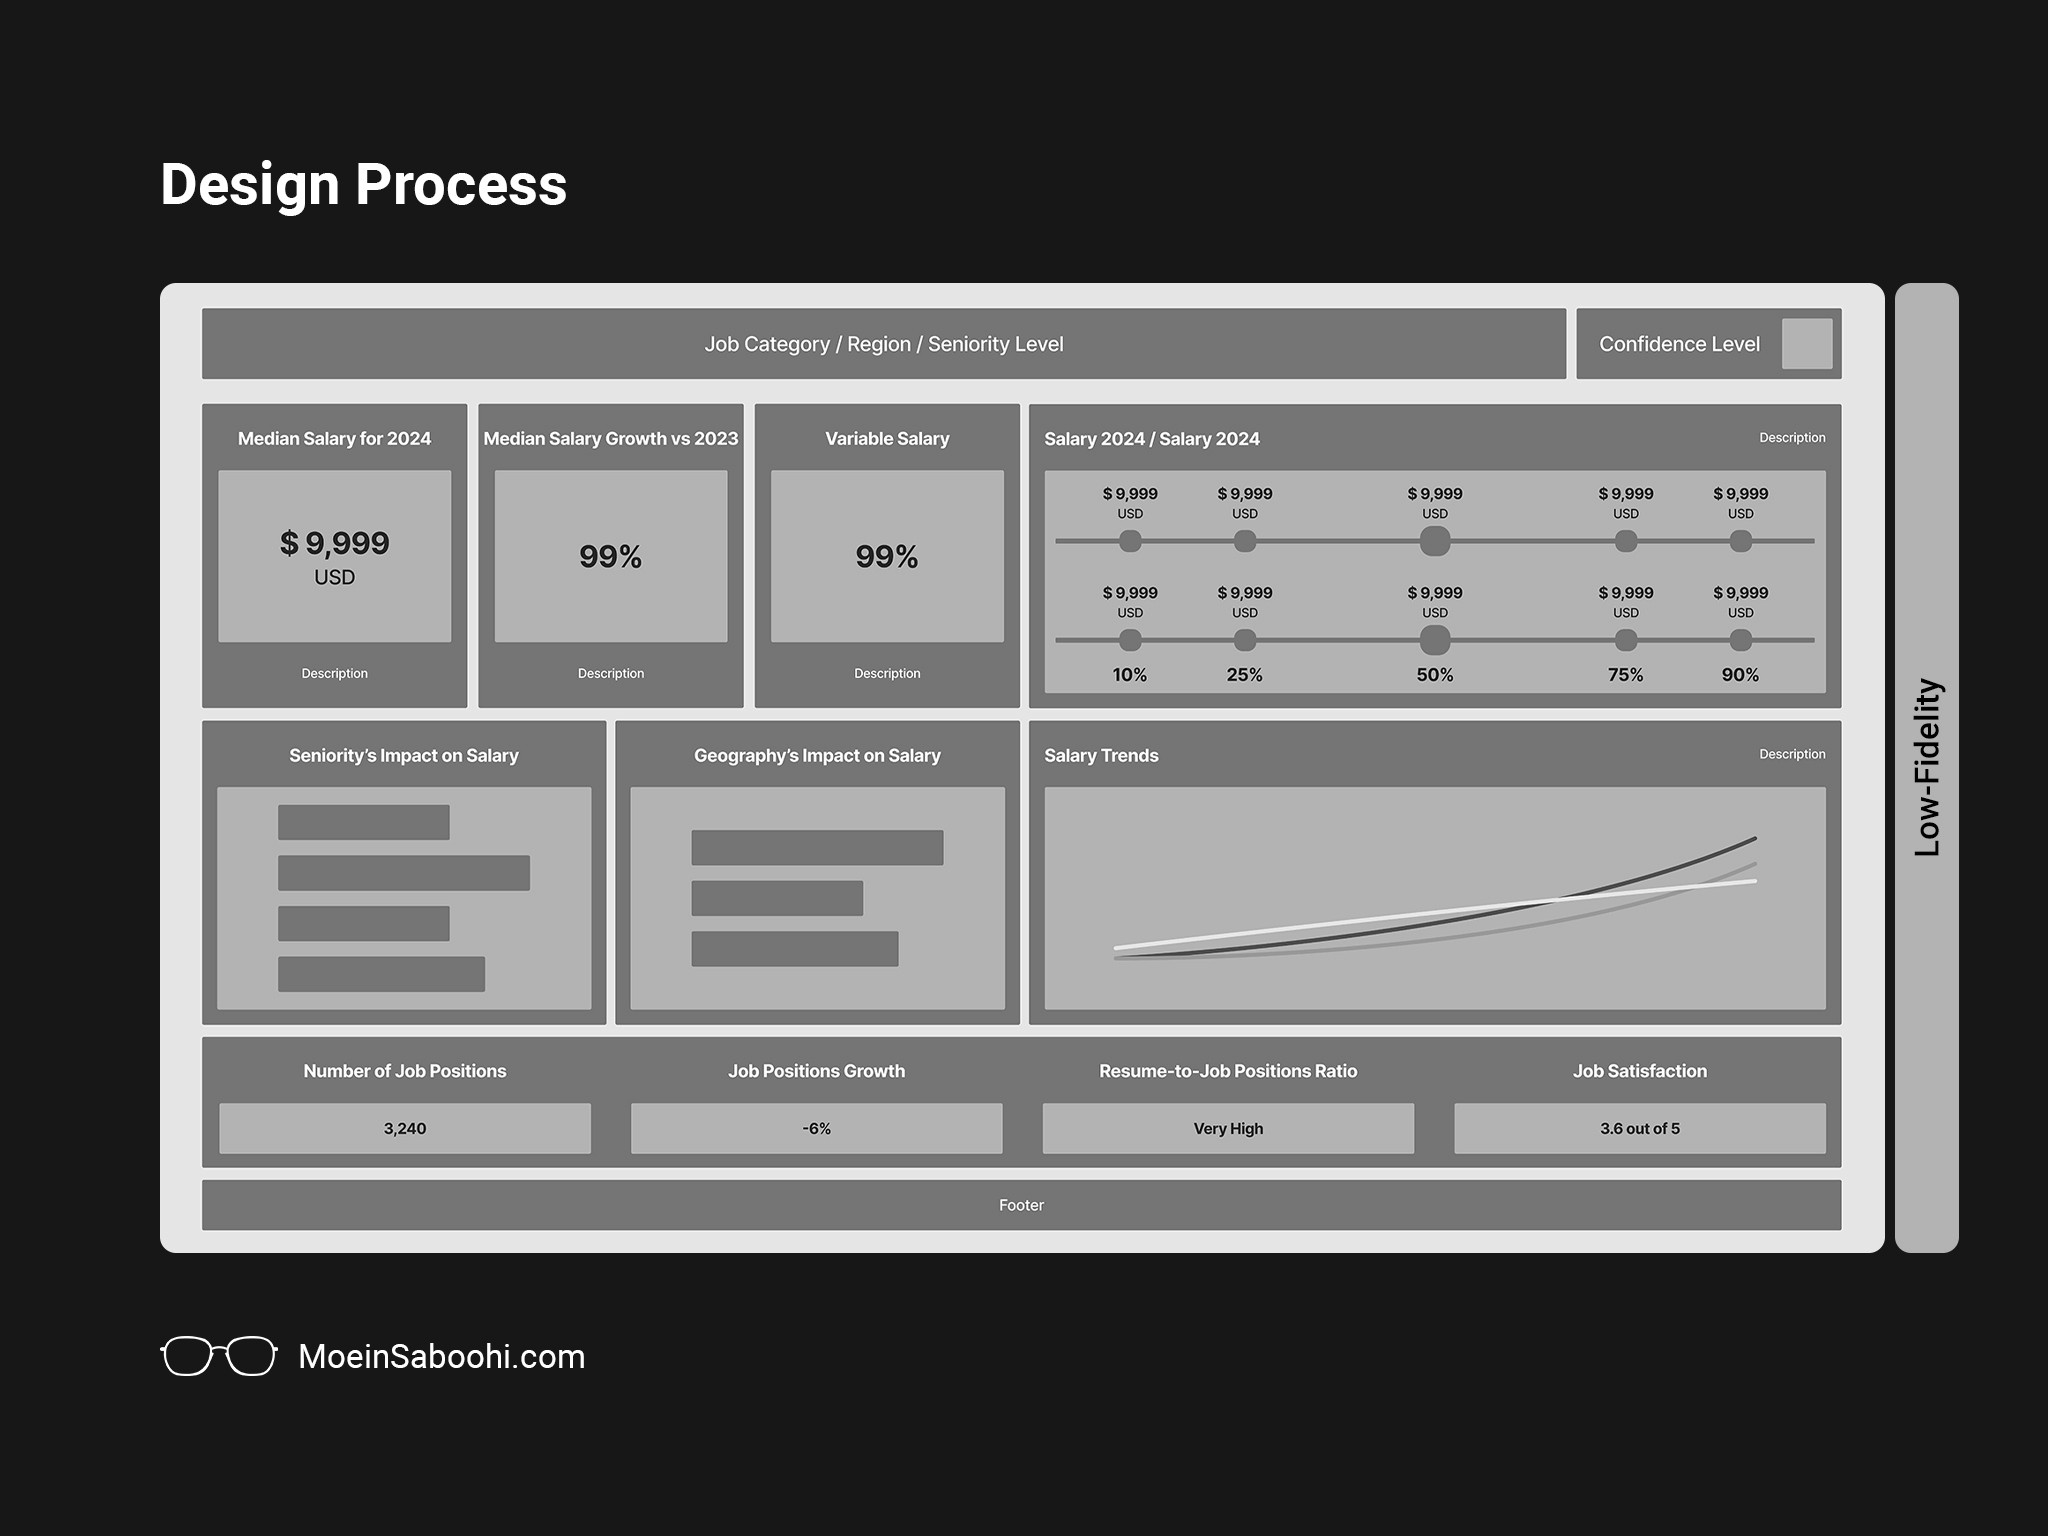
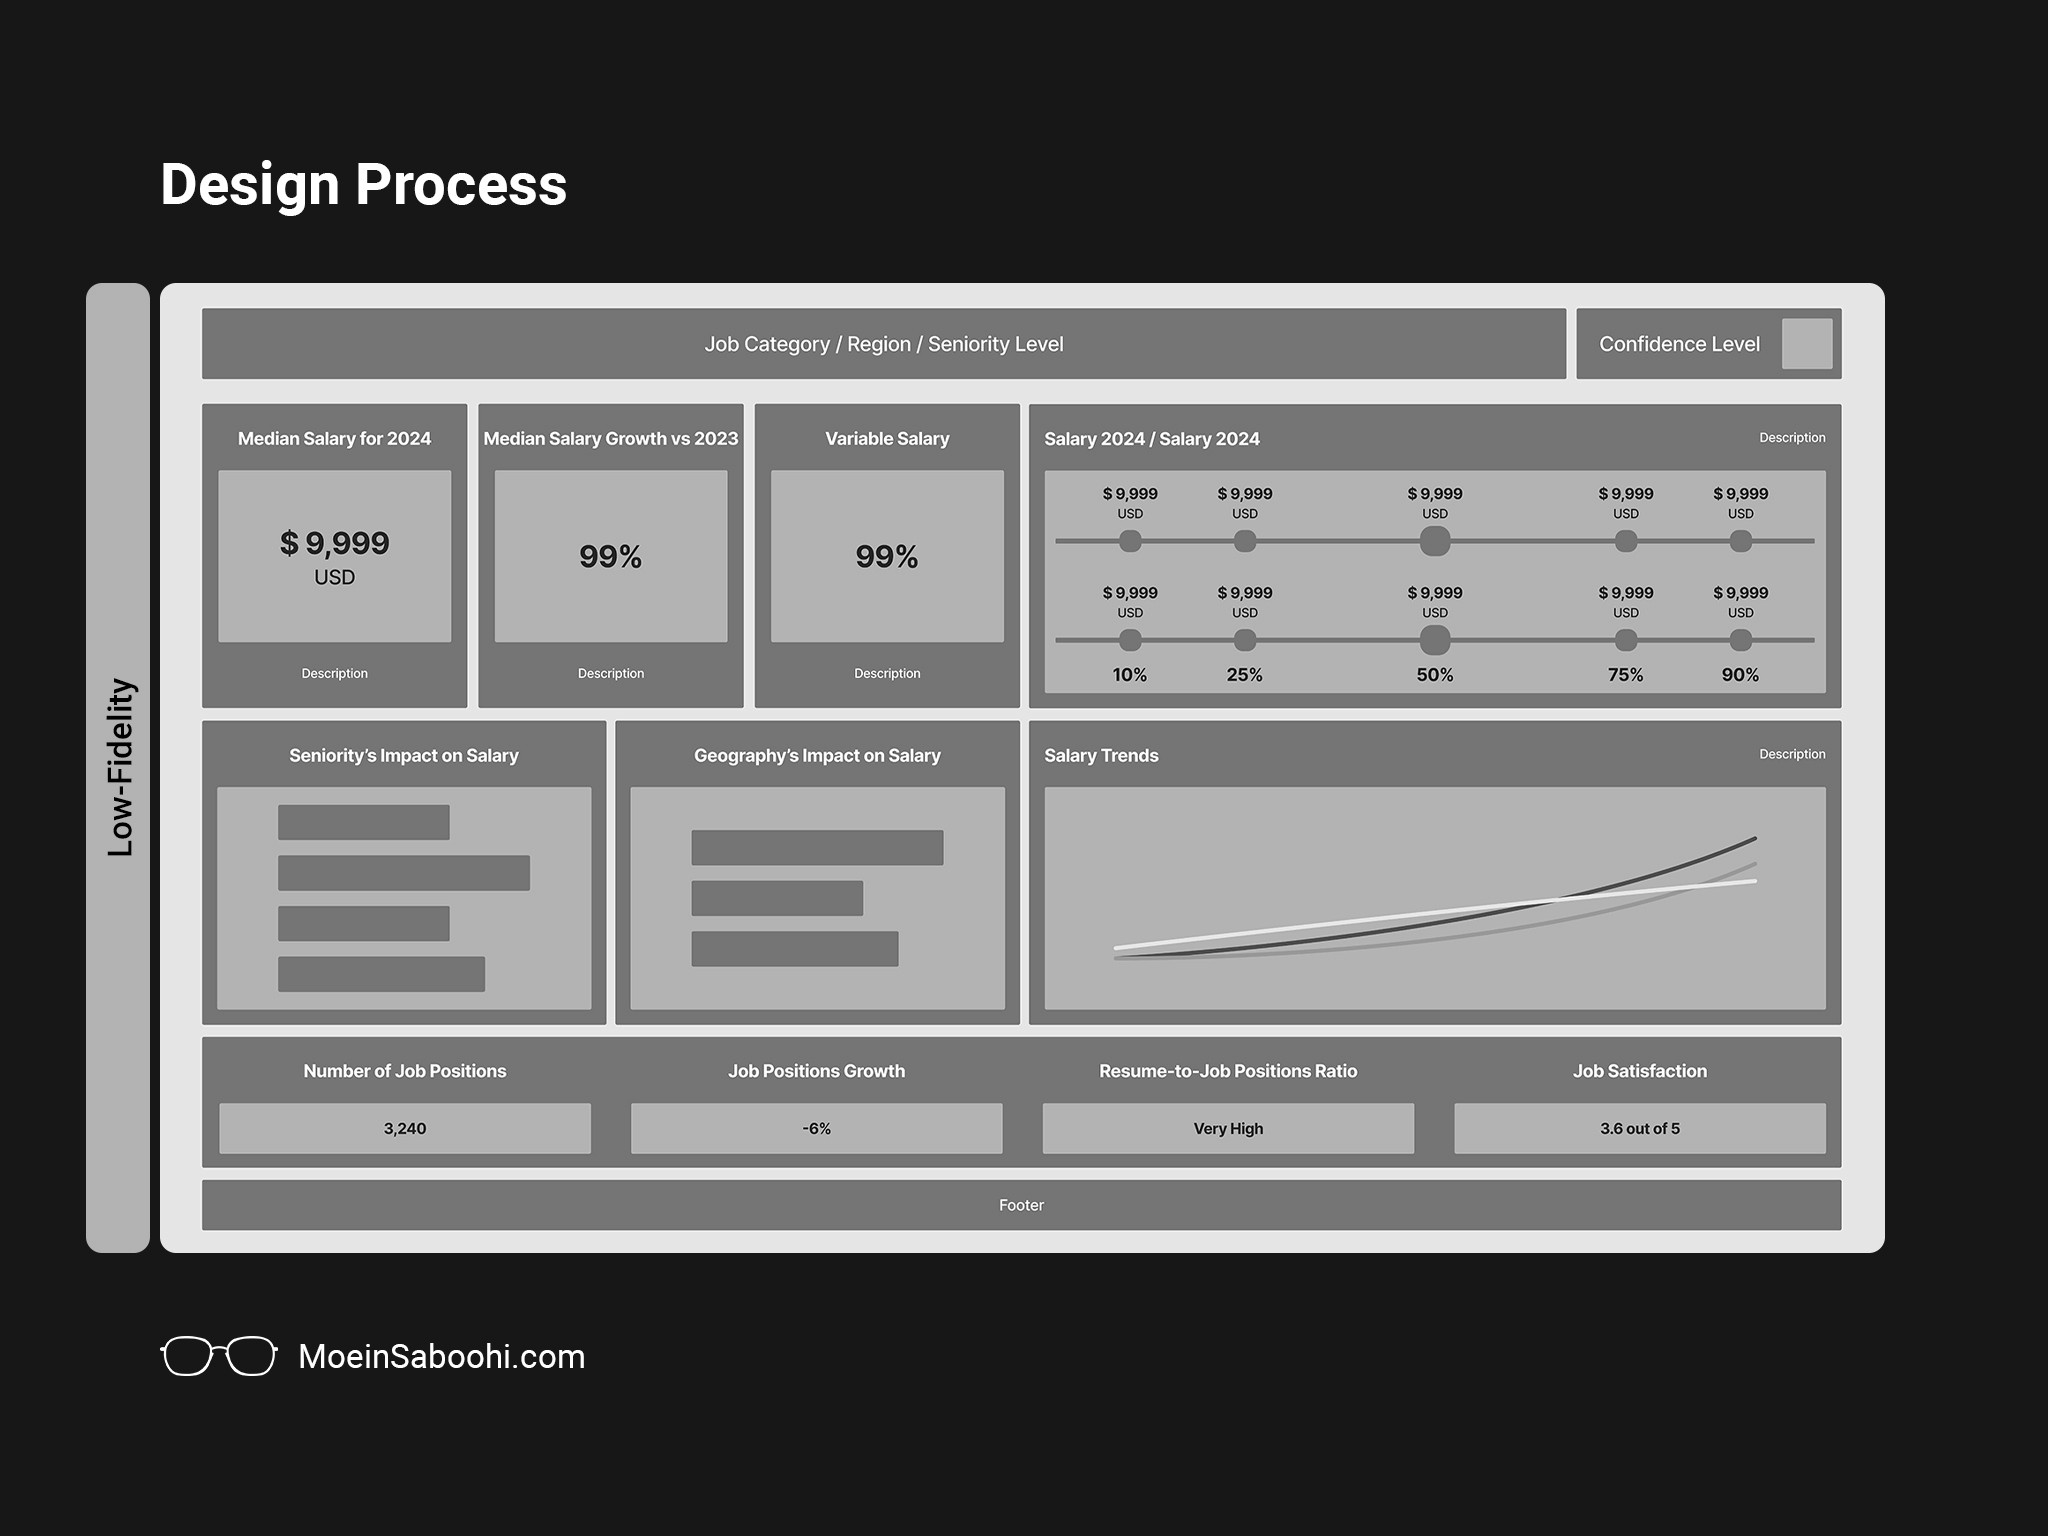
Designing Process
The design process began with low-fidelity wireframes to establish the structure and flow of the report. These designs focused on core elements like navigation, chart placement, and content hierarchy. We tested various layouts to ensure the information was easy to find and interpret, allowing for early feedback before moving to detailed design.
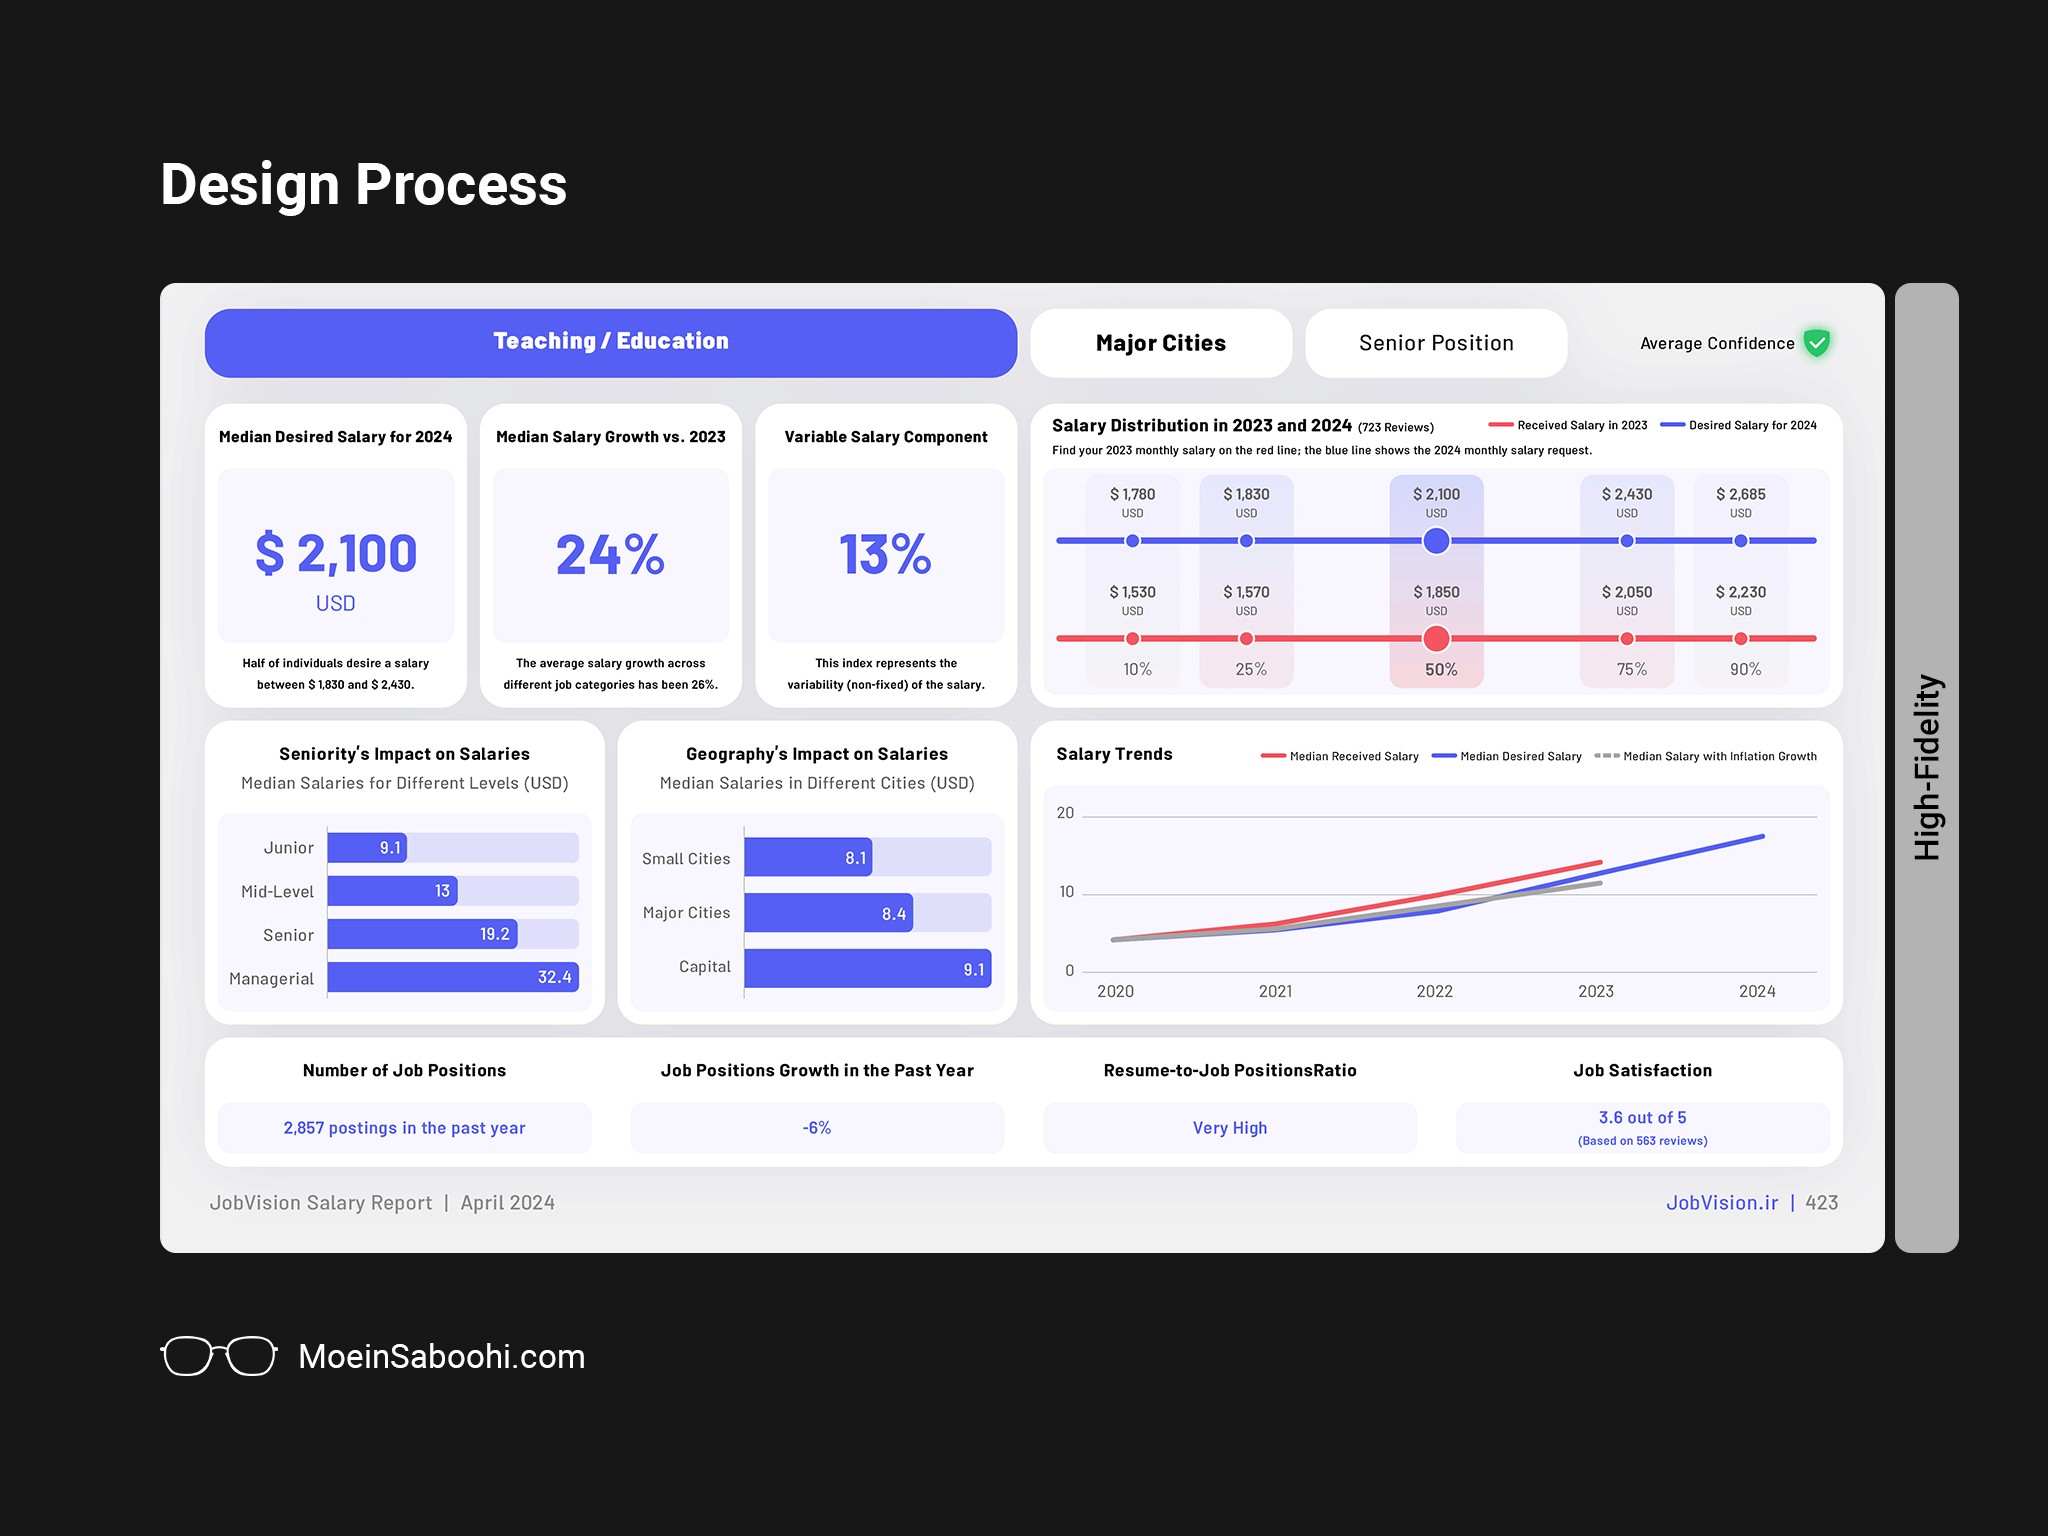
Once the structure was validated, we transitioned to high-fidelity designs, incorporating branding elements, refined typography, and color schemes. At this stage:
Charts: Visual elements like bubble charts for job categories and salary trends were integrated, emphasizing clarity and accessibility.
Editable Structure: The design was optimized for easy editing to accommodate team members without design expertise. This ensured seamless data updates and quick adjustments, reducing dependency on designers.
Interactive Features: High-fidelity prototypes included clickable elements for testing navigation and exploring insights.
This iterative approach allowed us to identify potential usability issues early and refine visual and interactive details, creating a polished and user-friendly final design.
User Testing Process
We conducted usability tests, interviews with 20+ participants, and a survey involving job seekers, HR managers, and industry professionals to refine the design. Participants completed tasks such as exploring salary trends and comparing job categories, offering valuable feedback on navigation, chart readability, and layout.
Success Metrics
Data Comprehension: Percentage of users accurately interpreting key charts and salary data.
Navigation Efficiency: Time taken to find specific information, like salary ranges.
Usability Score: User satisfaction with layout, readability, and interaction.
Key Insights
Data Comprehension: 75% of HR managers and 60% of job seekers accurately interpreted key charts, with 25% of users requiring additional guidance for visuals like bubble charts.
Navigation Efficiency: Users took an average of 65 seconds to locate salary information, with 70% completing it in under 90 seconds.
Usability Score: While 72% of users were satisfied, 28% struggled with certain layouts and chart clarity.
These insights shaped targeted refinements, ensuring the final design met diverse user needs.
Iteration and Improvement
The iteration process involved gathering user feedback from the 2022 report, leading to specialized content and guides in 2023. In 2024, we redesigned the salary magazine, added more job-specific data, and automated page generation.
After releasing the first report in 2022, we conducted user feedback surveys through questionnaires and interviews. The results revealed two distinct audience groups:
The first group, primarily employers and HR professionals, understood the data and charts but felt that the information was too broad and limited in scope.
The second group, mostly job seekers, struggled to interpret the data and charts, finding them confusing.
We had anticipated that the second group might face challenges due to the novelty of the report and its data. However, we believed that by publishing the report annually, users would gradually become more familiar with the format and learn to navigate its content more effectively.
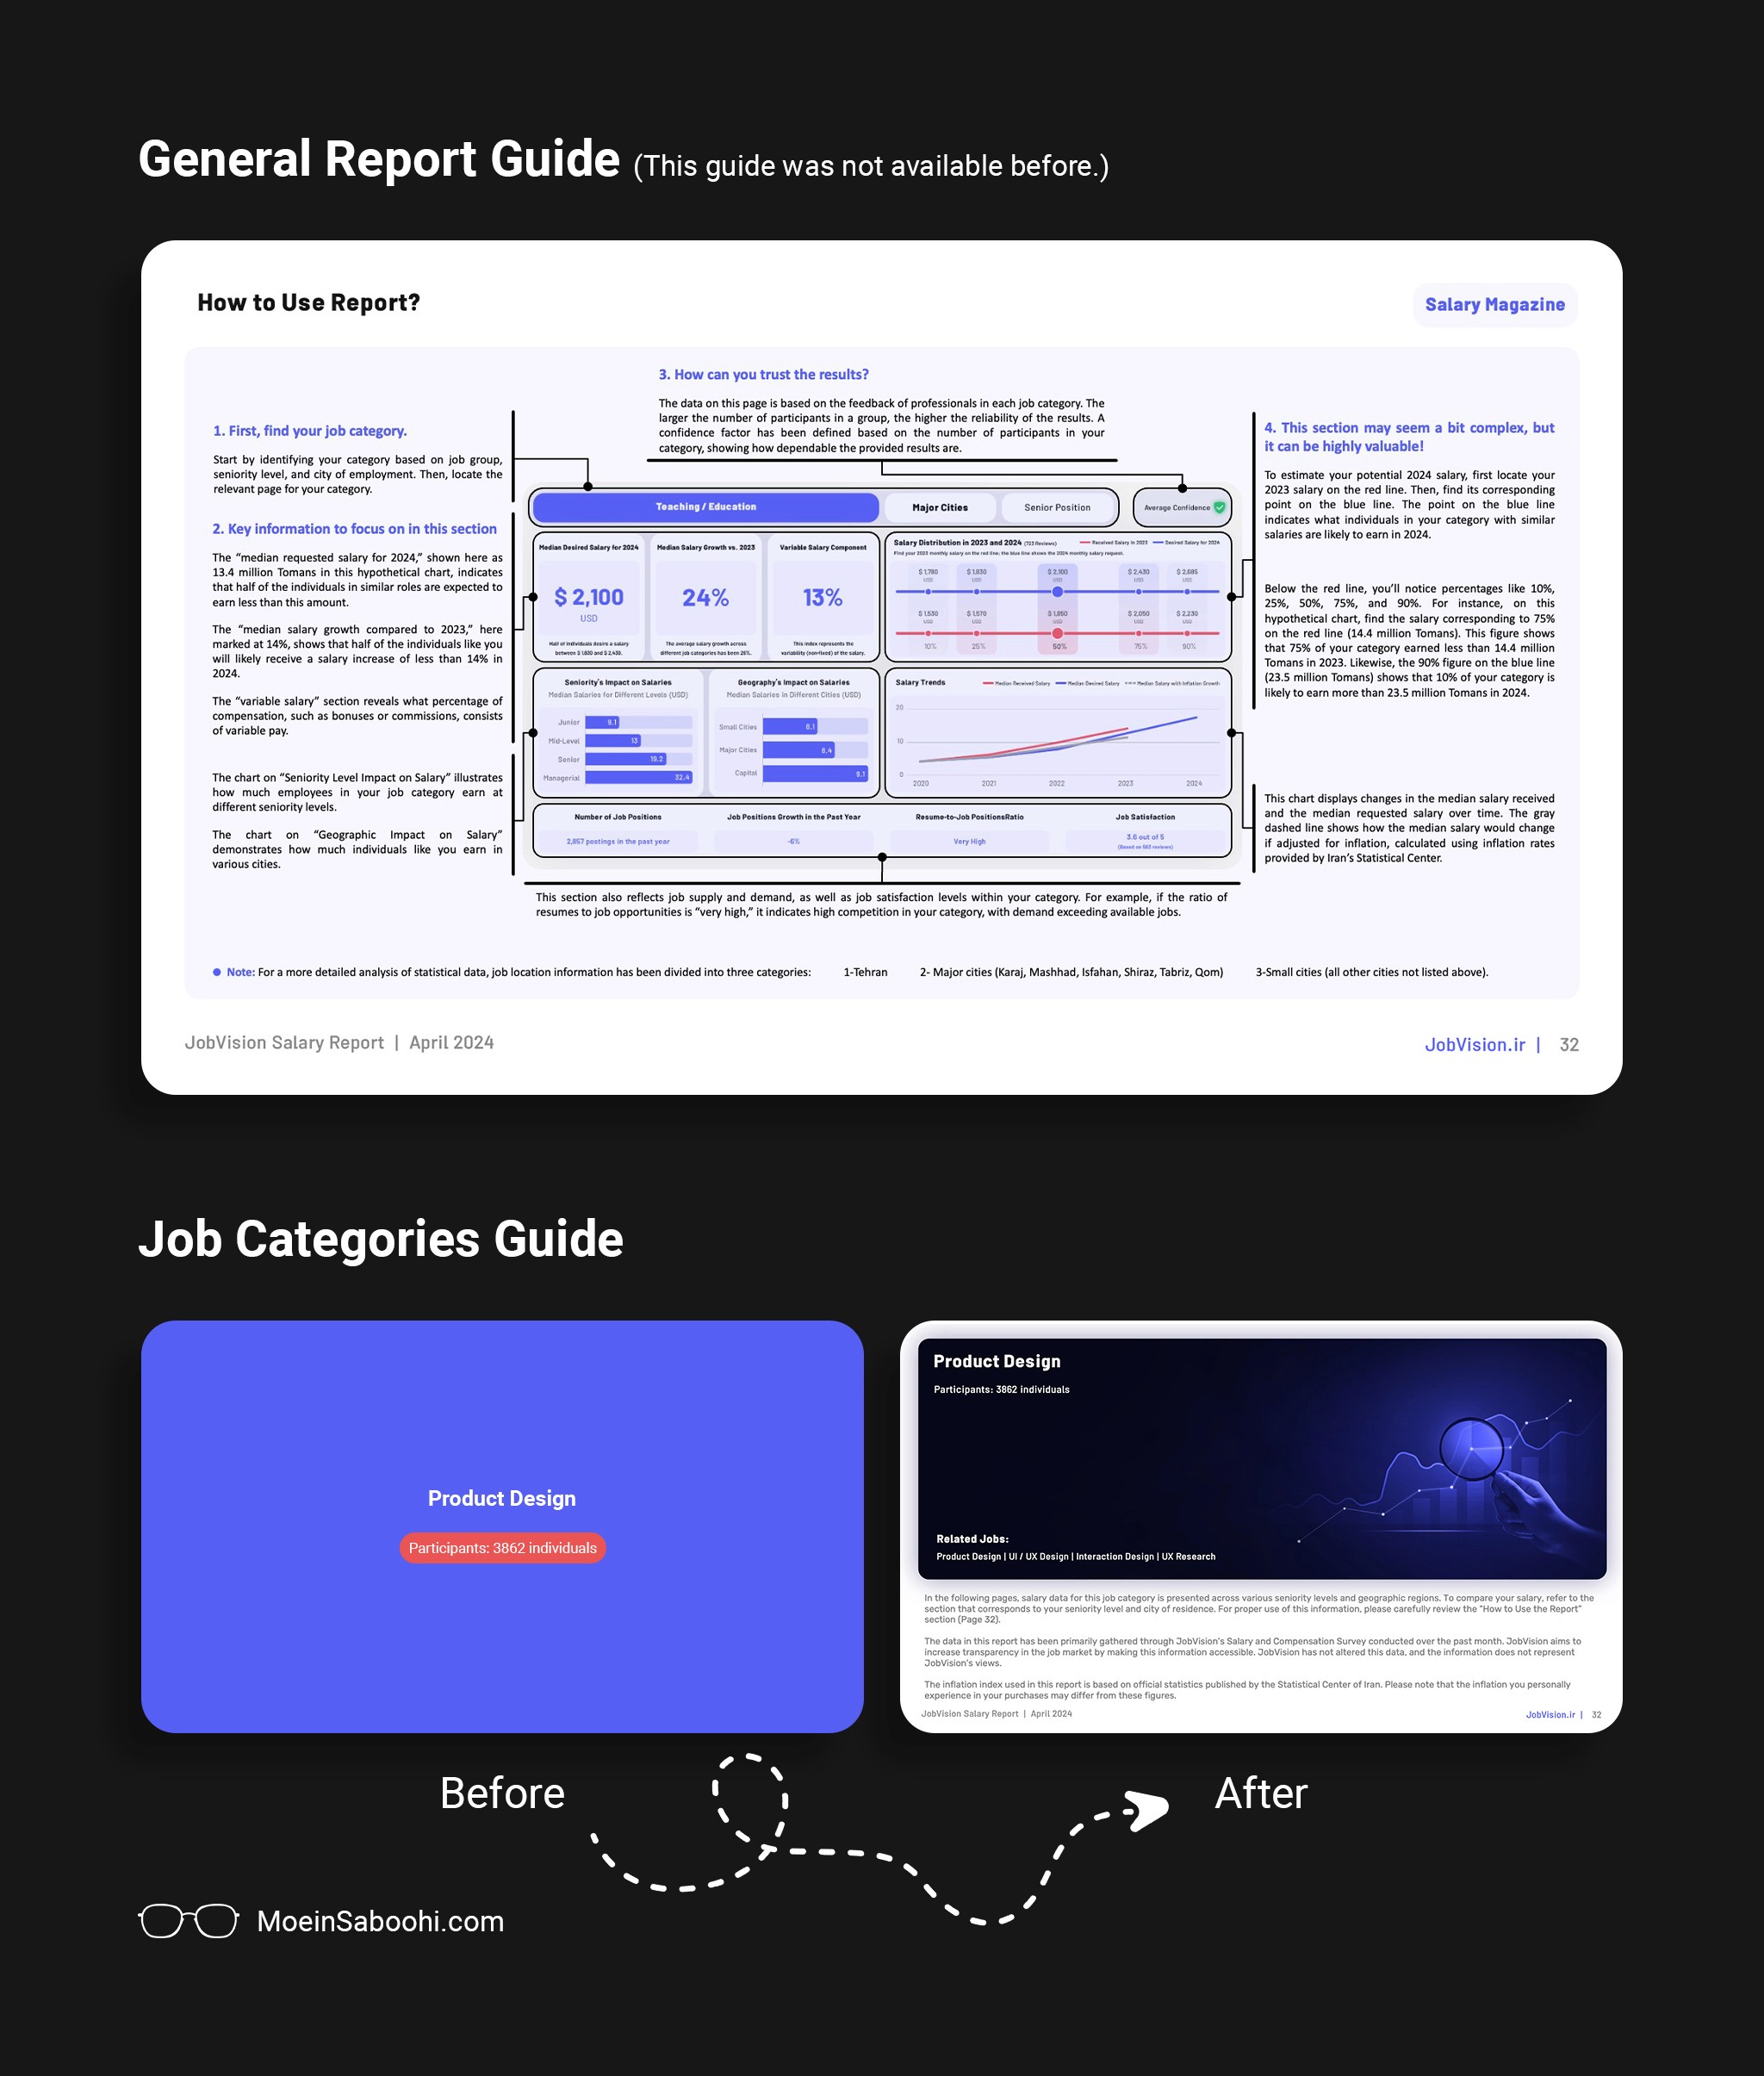
To improve the 2023 report while retaining its core structure, we pursued two key strategies:
Adding specialized content: We expanded the insights section to include more detailed and specific information, aiming to better meet the expectations of the first group.
Incorporating three types of guides: These guides were integrated across various report sections to help all users understand the charts and make the report more accessible to everyone.
After releasing the second edition of the report in 2023, we once again conducted feedback surveys and interviews. The findings showed that the updated report had successfully resolved the initial issues. However, a new need emerged: job seekers wanted more detailed information specific to their job categories.
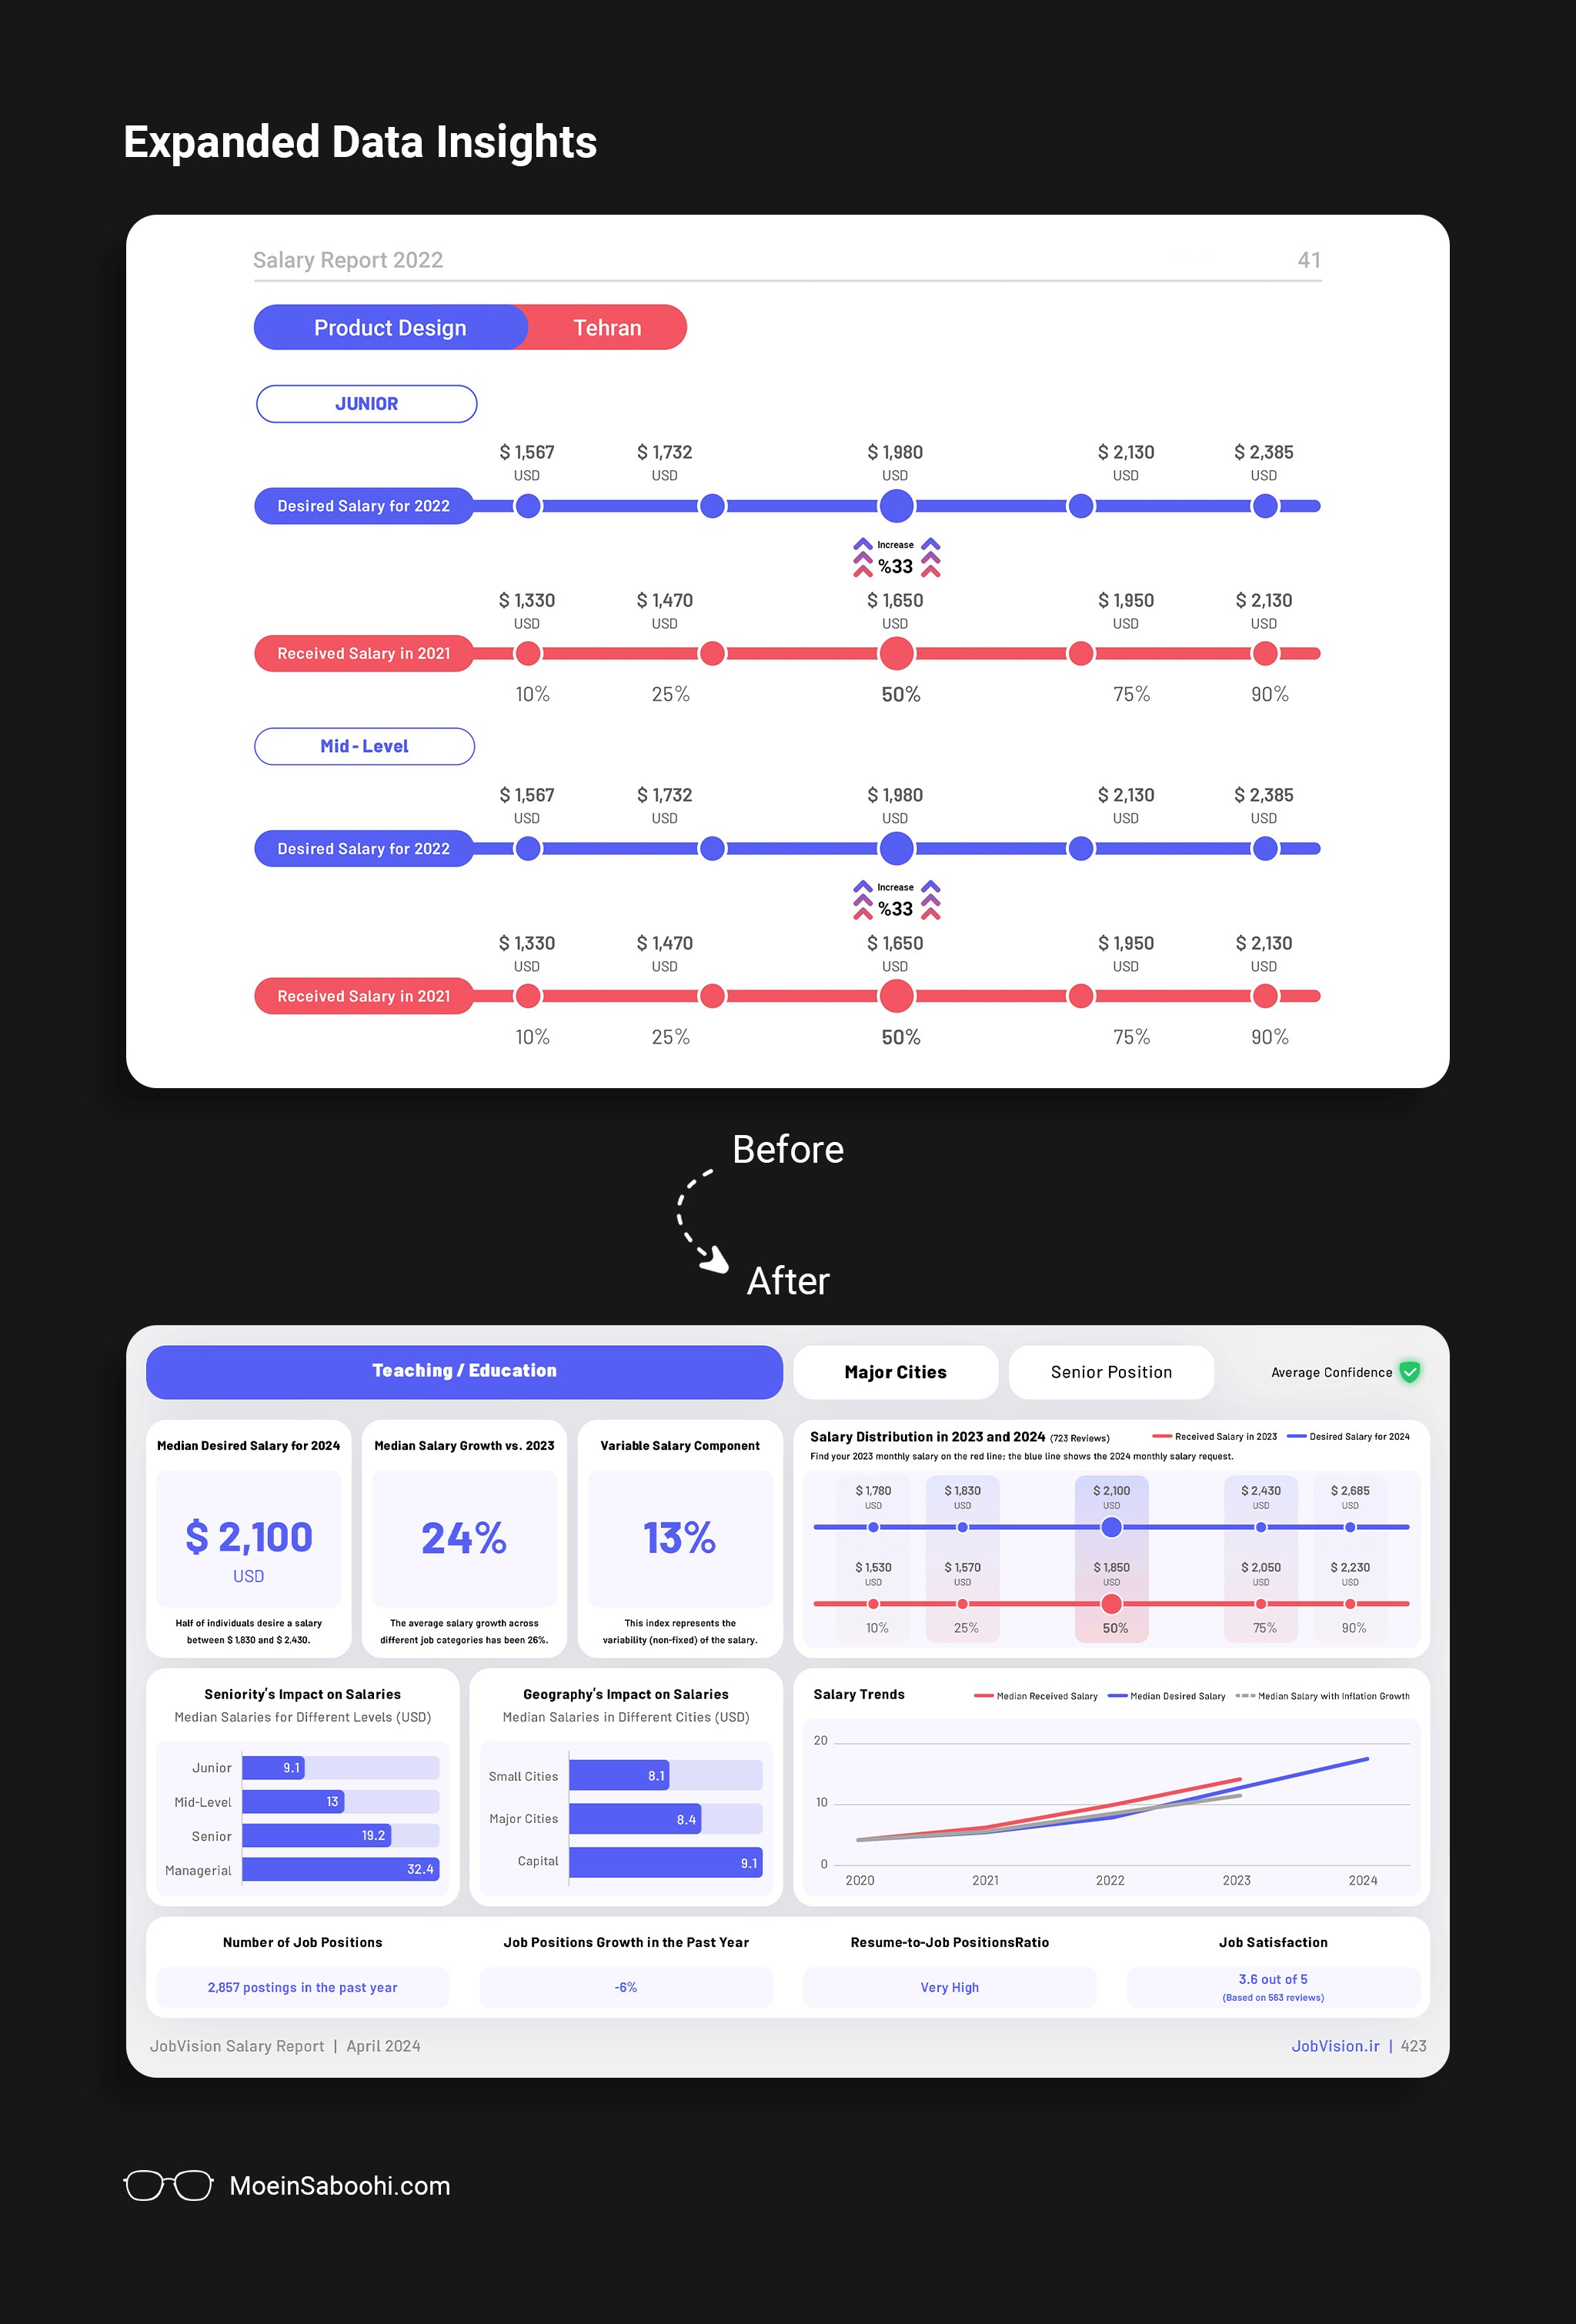
To address this, we revisited the initial survey data and re-analyzed the available statistics. Ultimately, we decided to redesign the salary magazine section. This involved:
Presenting additional data, such as salary growth trends over the years and their alignment with inflation rates.
Recognizing the importance of this information within the Iranian economic context, particularly for each job category.
We explored various designs for the salary magazine pages, experimenting with different layouts and chart types. During this phase, we conducted interviews and usability tests with diverse user groups (job seekers, employers, HR specialists, etc.). Based on the feedback, we refined the designs and finalized a new version of these pages.
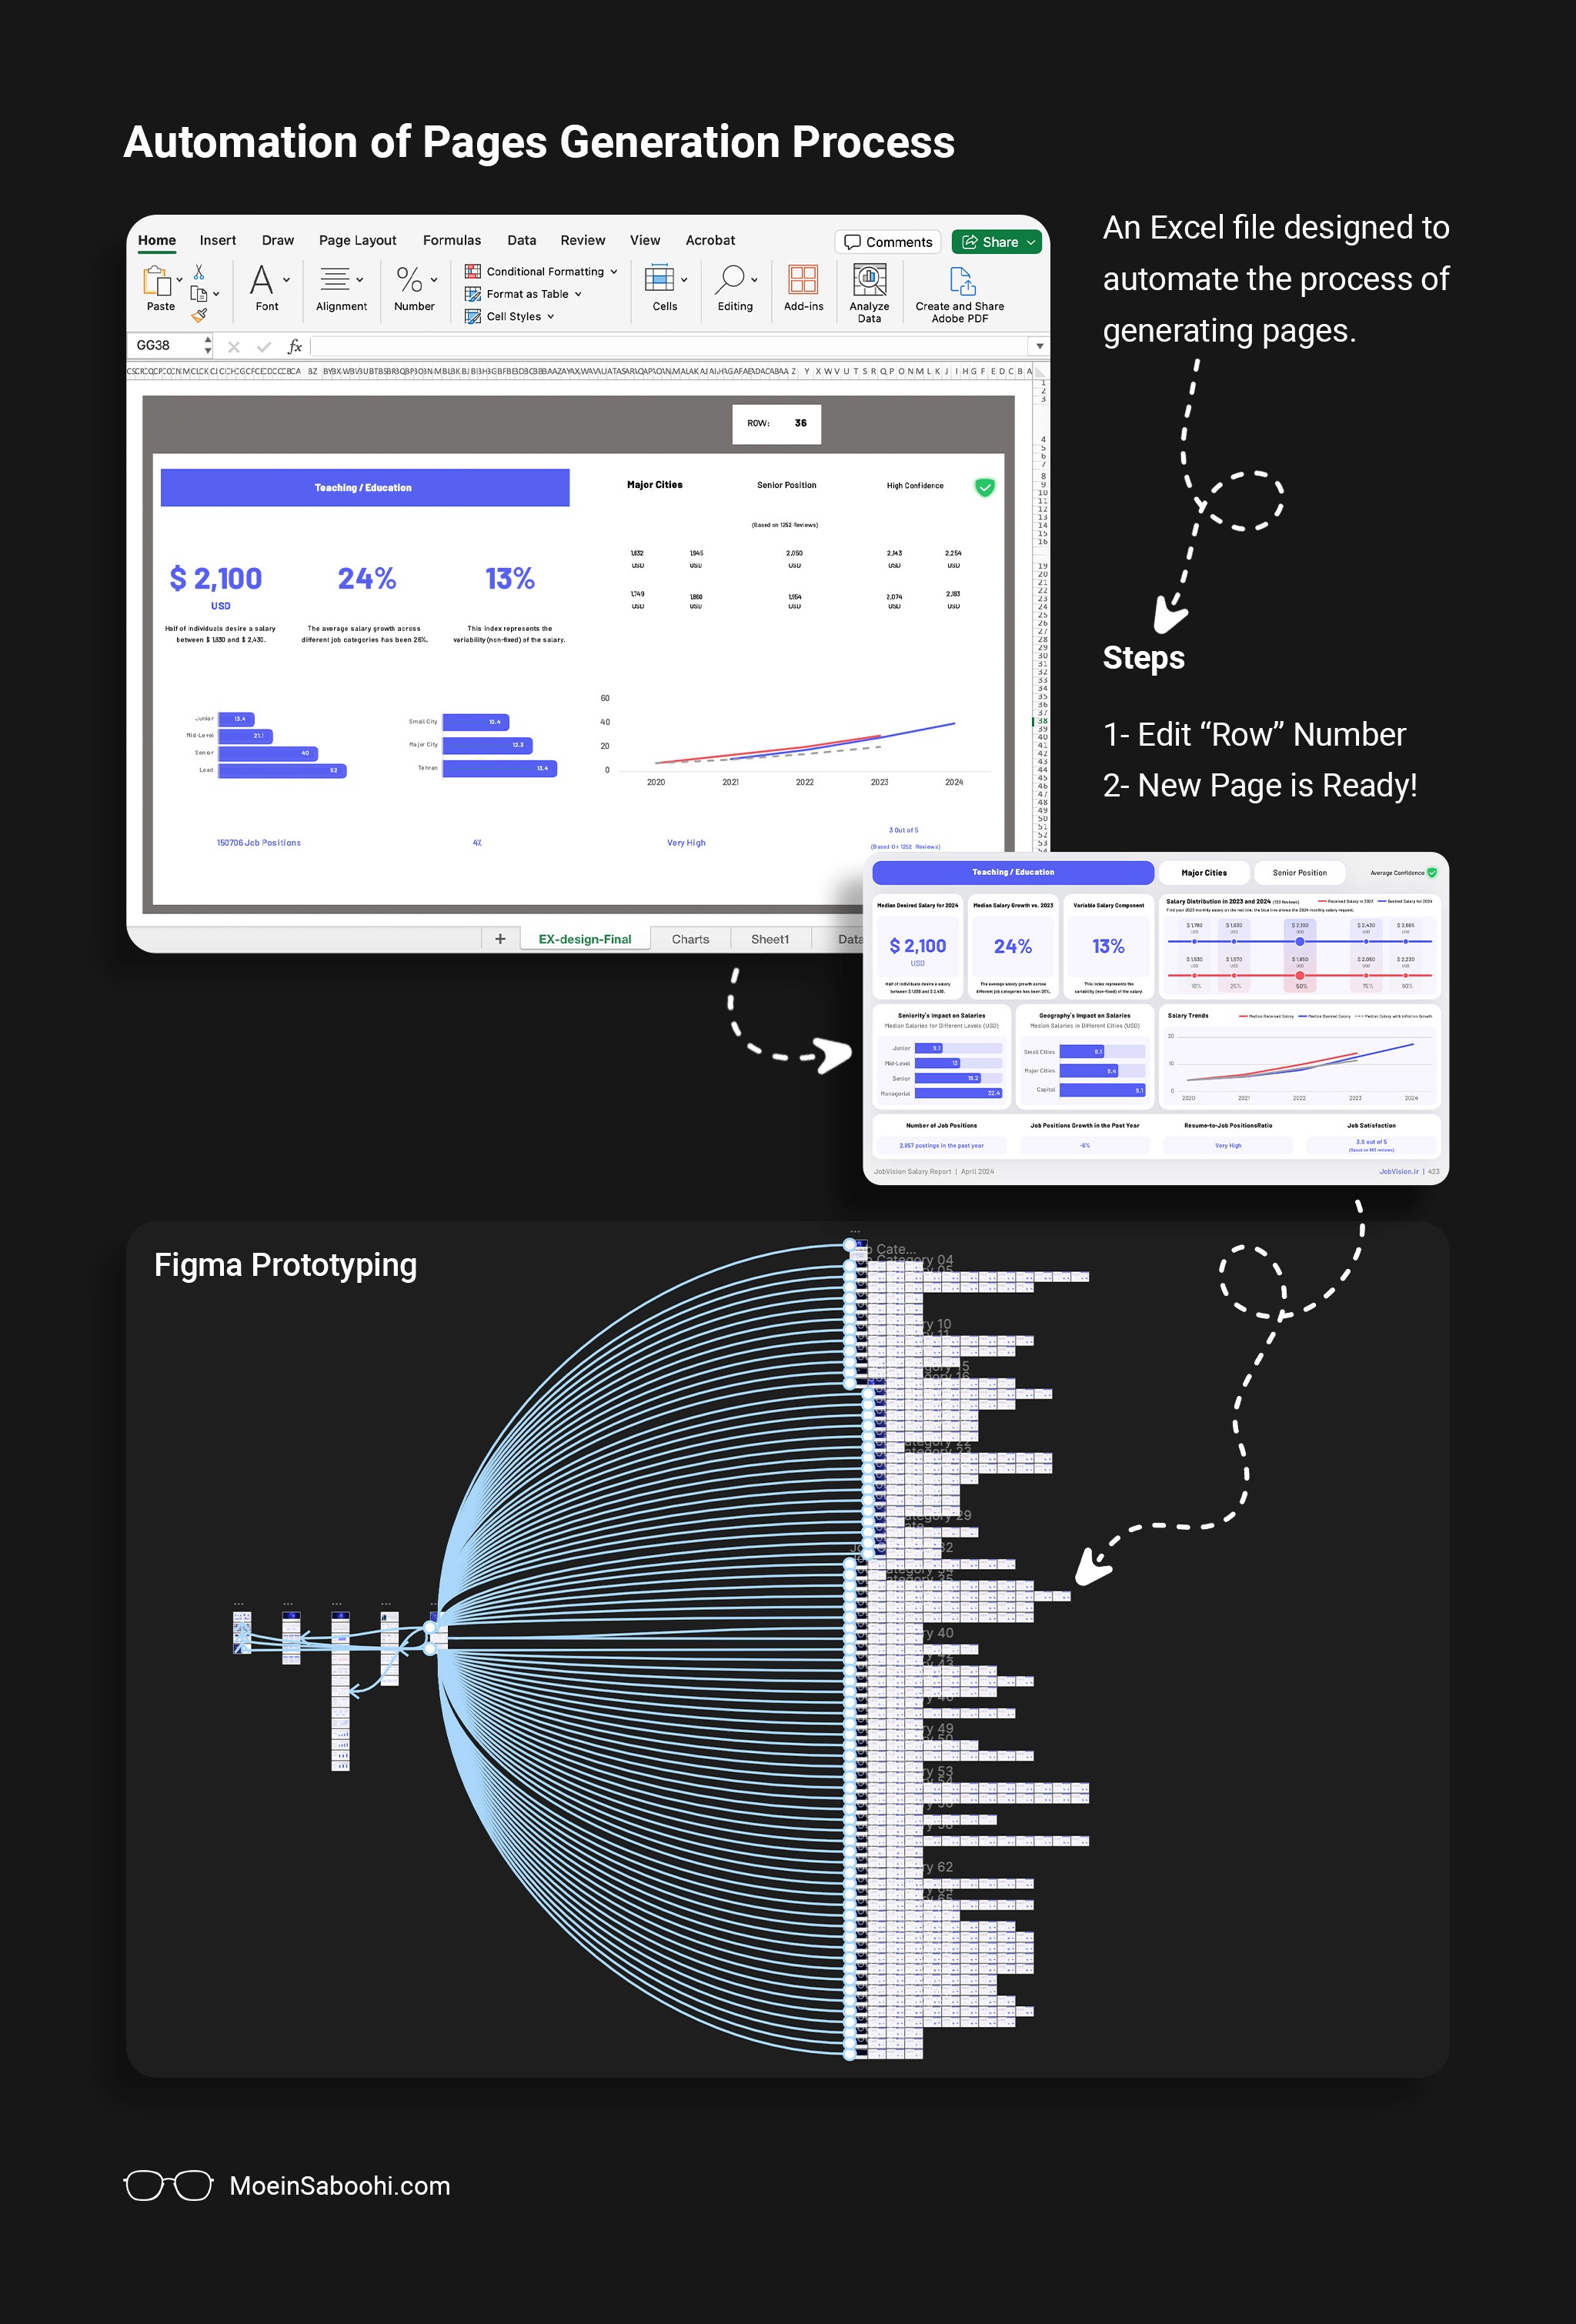
At this stage, the report team faced a recurring challenge: the updated design was so detailed that manually creating pages for each job category was no longer feasible.
To solve this, we collaborated with the technical team to develop an automated solution for generating pages based on the new design. However, due to tight production timelines and the approaching release date, implementing this automated solution wasn’t immediately possible.
In the end, I worked with the report team to devise an interim solution. By leveraging Excel data and adapting it to the existing design, we automated the page generation process temporarily. This workaround allowed us to successfully publish the 2024 report while maintaining the improved quality and detail.
Outcome and Future Enhancements
The solution introduced a Salary Calculator for real-time estimates and a Job Magazine with detailed job insights, both available on JobVision’s website.
The final solution led to two additional digital tools:
Salary Calculator: Allows users to estimate salaries in real time based on the latest data.
Link to JobVision Salary Calculator (It’s in the Persian language)Job Magazine: Provides comprehensive job-specific insights on the website.
Link to JobVision Job Magazine (It’s in the Persian language)
The design evolution of the JobVision Annual Salary Report showcases a balance between user needs, business goals, and technical constraints. Below are the key visuals from the 2024 report: